Author: Emmanuel Dollinger
Introduction
Goal of this notebook is to align mouse single cell transcriptomic reads using cellranger and kallisto to compare the outputs. All cellranger code was ran on the HPC3, all kallisto code was run on a desktop with 10 cores (which right there is a clue as to which aligner I prefer). I copied the code ran on the HPC3 below.
Part 1: cellranger
First I built a reference, see https://support.10xgenomics.com/single-cell-gene-expression/software/pipelines/latest/using/tutorial_mr
# wget files from Ensembl:
# !wget ftp://ftp.ensembl.org/pub/release-103/fasta/mus_musculus/dna/Mus_musculus.GRCm39.dna.primary_assembly.fa.gz
# !wget ftp://ftp.ensembl.org/pub/release-103/gtf/mus_musculus/Mus_musculus.GRCm39.103.gtf.gz
Uploaded both files to HPC3 using scp.
First filtered the gtf, script submitted: (see https://rcic.uci.edu/hpc3/examples.html for slurm script examples)
#!/bin/bash

#SBATCH --job-name=cellrangermkref      ## Name of the job.
#SBATCH -A qnie_lab     ## account to charge
#SBATCH -p standard          ## partition/queue name
#SBATCH --nodes=1            ## (-N) number of nodes to use
#SBATCH --ntasks=1           ## (-n) number of tasks to launch
#SBATCH --cpus-per-task=10    ## number of cores the job needs
#SBATCH --error=slurm-%J.err ## error log file

# Attempt to make custom cellranger reference. See https://support.10xgenomics.com/single-cell-gene-expression/software/pipelines/latest/using/tutorial_mr

module load cellranger/3.1.0

cellranger mkgtf \
/pub/edolling/GenPALSReadAlignerComparison/Data/Mus_musculus.GRCm39.103.gtf \
/pub/edolling/GenPALSReadAlignerComparison/Data/Mus_musculus.GRCm39.103.filtered.gtf
Took >5 minutes.
Now create custom index: Notice the queue I submitted to is the highmem queue, you need to ask the HPC3 folks to add you to this queue.
#!/bin/bash

#SBATCH --job-name=cellrangermkref      ## Name of the job.
#SBATCH -A qnie_lab     ## account to charge
#SBATCH -p highmem          ## partition/queue name
#SBATCH --nodes=1            ## (-N) number of nodes to use
#SBATCH --ntasks=1           ## (-n) number of tasks to launch
#SBATCH --cpus-per-task=20    ## number of cores the job needs
#SBATCH --error=slurm-%J.err ## error log file

# Attempt to make custom cellranger reference. See https://support.10xgenomics.com/single-cell-gene-expression/software/pipelines/latest/using/tutorial_mr

module load cellranger/3.1.0

cellranger mkref \
--genome=cellranger_ref_GRCm39.103 \
--genes=/pub/edolling/GenPALSReadAlignerComparison/Data/Mus_musculus.GRCm39.103.filtered.gtf \
--fasta=/pub/edolling/GenPALSReadAlignerComparison/Data/Mus_musculus.GRCm39.dna.primary_assembly.fa
~45 minutes.
Now I actually ran the aligner on that index. This took on the order of 5h with 2 nodes * 20 cores. Below is the code to align mouse F1, F2 was exactly the same.
#!/bin/bash

#SBATCH --job-name=count_F1      ## Name of the job.
#SBATCH -A qnie_lab     ## account to charge
#SBATCH -p highmem          ## partition/queue name
#SBATCH --nodes=2            ## (-N) number of nodes to use
#SBATCH --ntasks=2           ## (-n) number of tasks to launch
#SBATCH --cpus-per-task=20    ## number of cores the job needs
#SBATCH --error=slurm-%J.err ## error log file

# Run cellranger count on reads. Index was filtered in cellrangerfiltergtf.sub and built in cellrangermkref.sub.
module load cellranger/3.1.0

cellranger count --id=cellrangercomparison_F1 --fastqs=/pub/edolling/GenPALSReadAlignerComparison/Data/GliPtch6wtam/F1Reads \
--transcriptome=/pub/edolling/GenPALSReadAlignerComparison/Data/cellranger_ref_GRCm39.103 \
scp the files down to the desktop.
#eg
# scp edolling@hpc3.rcic.uci.edu:/pub/edolling/GenPALSReadAlignerComparison/Code/cellrangercomparison_F2/outs/raw_feature_bc_matrix.h5 ./
Part 2: kallisto code.
As specified above, all code in this section was run on a desktop with 10 cores. Also notice that the reads and the files I used to build the index are the same as in part 1, but for kallisto I concatenated the reads just to make my life a little easier.
import os
!pwd
/Users/emmanueldollinger/Documents/Projects/GenPALS/Code
!kb ref -i ../Data/transcriptome.idx -g ../Data/transcripts_to_genes.txt -f1 ../Data/cdna.fa \
~/Documents/Projects/BulkRNAseq/Data/IndexFilesGRCm39.103/Mus_musculus.GRCm39.dna.primary_assembly.fa.gz \
~/Documents/Projects/BulkRNAseq/Data/IndexFilesGRCm39.103/Mus_musculus.GRCm39.103.filtered.gtf
[2021-03-29 11:05:53,300]    INFO Preparing /Users/emmanueldollinger/Documents/Projects/BulkRNAseq/Data/IndexFilesGRCm39.103/Mus_musculus.GRCm39.dna.primary_assembly.fa.gz, /Users/emmanueldollinger/Documents/Projects/BulkRNAseq/Data/IndexFilesGRCm39.103/Mus_musculus.GRCm39.103.filtered.gtf
[2021-03-29 11:05:53,300]    INFO Creating transcript-to-gene mapping at /Users/emmanueldollinger/Documents/Projects/GenPALS/Code/tmp/tmp2mjuur6u
[2021-03-29 11:06:24,915]    INFO Decompressing /Users/emmanueldollinger/Documents/Projects/BulkRNAseq/Data/IndexFilesGRCm39.103/Mus_musculus.GRCm39.dna.primary_assembly.fa.gz to tmp
[2021-03-29 11:06:38,892]    INFO Sorting tmp/Mus_musculus.GRCm39.dna.primary_assembly.fa to /Users/emmanueldollinger/Documents/Projects/GenPALS/Code/tmp/tmp179k8x_7
[2021-03-29 11:12:21,963]    INFO Sorting /Users/emmanueldollinger/Documents/Projects/BulkRNAseq/Data/IndexFilesGRCm39.103/Mus_musculus.GRCm39.103.filtered.gtf to /Users/emmanueldollinger/Documents/Projects/GenPALS/Code/tmp/tmp3ez7oqdu
[2021-03-29 11:13:19,371]    INFO Splitting genome tmp/Mus_musculus.GRCm39.dna.primary_assembly.fa into cDNA at /Users/emmanueldollinger/Documents/Projects/GenPALS/Code/tmp/tmpnvnlj06p
[2021-03-29 11:13:19,371] WARNING The following chromosomes were found in the FASTA but does not have any "transcript" features in the GTF: GL456382.1, GL456372.1, MU069434.1, GL456239.1, JH584301.1, GL456394.1, JH584302.1, GL456381.1, MU069435.1, GL456379.1, GL456367.1, GL456383.1, GL456387.1, GL456368.1, GL456389.1, JH584300.1, GL456359.1, GL456396.1, GL456392.1, GL456370.1, GL456390.1, GL456378.1, GL456385.1, GL456366.1, GL456360.1. No sequences will be generated for these chromosomes.
[2021-03-29 11:14:06,971]    INFO Wrote 140725 cDNA transcripts
[2021-03-29 11:14:06,976]    INFO Concatenating 1 transcript-to-gene mappings to ../Data/transcripts_to_genes.txt
[2021-03-29 11:14:07,050]    INFO Concatenating 1 cDNAs to ../Data/cdna.fa
[2021-03-29 11:14:07,729]    INFO Indexing ../Data/cdna.fa to ../Data/transcriptome.idx
Now concat the reads together (I’m assuming no batch effects between runs here).
!mkdir ../Data/CatFiles
!cat ../Data/Gli\ Ptch\ 6w\ tam\ scSeq/KW_6W_F1*R1*.fastq.gz > ../Data/CatFiles/F1_R1.fastq.gz
!cat ../Data/Gli\ Ptch\ 6w\ tam\ scSeq/KW_6W_F1*R2*.fastq.gz > ../Data/CatFiles/F1_R2.fastq.gz

!cat ../Data/Gli\ Ptch\ 6w\ tam\ scSeq/KW_6W_F2*R1*.fastq.gz > ../Data/CatFiles/F2_R1.fastq.gz
!cat ../Data/Gli\ Ptch\ 6w\ tam\ scSeq/KW_6W_F2*R2*.fastq.gz > ../Data/CatFiles/F2_R2.fastq.gz
!ls ../Data/CatFiles/
F1_R1.fastq.gz F1_R2.fastq.gz F2_R1.fastq.gz F2_R2.fastq.gz
Run kallisto on F1 and F2.
!kb count --h5ad -i ../Data/transcriptome.idx \
-g ../Data/transcripts_to_genes.txt -x 10XV3 \
-o ../Data/kallisto_align_F1 --filter bustools --overwrite -t 10 ../Data/CatFiles/F1_R1.fastq.gz ../Data/CatFiles/F1_R2.fastq.gz
[2021-03-29 12:11:37,260]    INFO Using index ../Data/transcriptome.idx to generate BUS file to ../Data/kallisto_align_F1 from
[2021-03-29 12:11:37,260]    INFO         ../Data/CatFiles/F1_R1.fastq.gz
[2021-03-29 12:11:37,260]    INFO         ../Data/CatFiles/F1_R2.fastq.gz
[2021-03-29 12:16:42,491]    INFO Sorting BUS file ../Data/kallisto_align_F1/output.bus to ../Data/kallisto_align_F1/tmp/output.s.bus
[2021-03-29 12:17:40,312]    INFO Whitelist not provided
[2021-03-29 12:17:40,312]    INFO Copying pre-packaged 10XV3 whitelist to ../Data/kallisto_align_F1
[2021-03-29 12:17:40,904]    INFO Inspecting BUS file ../Data/kallisto_align_F1/tmp/output.s.bus
[2021-03-29 12:18:17,413]    INFO Correcting BUS records in ../Data/kallisto_align_F1/tmp/output.s.bus to ../Data/kallisto_align_F1/tmp/output.s.c.bus with whitelist ../Data/kallisto_align_F1/10xv3_whitelist.txt
[2021-03-29 12:18:50,875]    INFO Sorting BUS file ../Data/kallisto_align_F1/tmp/output.s.c.bus to ../Data/kallisto_align_F1/output.unfiltered.bus
[2021-03-29 12:19:27,397]    INFO Generating count matrix ../Data/kallisto_align_F1/counts_unfiltered/cells_x_genes from BUS file ../Data/kallisto_align_F1/output.unfiltered.bus
[2021-03-29 12:20:20,001]    INFO Reading matrix ../Data/kallisto_align_F1/counts_unfiltered/cells_x_genes.mtx
[2021-03-29 12:20:47,966]    INFO Writing matrix to h5ad ../Data/kallisto_align_F1/counts_unfiltered/adata.h5ad
/Users/emmanueldollinger/miniconda3/lib/python3.7/site-packages/anndata/_core/anndata.py:1192: FutureWarning: is_categorical is deprecated and will be removed in a future version.  Use is_categorical_dtype instead
  if is_string_dtype(df[key]) and not is_categorical(df[key])
... storing 'gene_name' as categorical
[2021-03-29 12:20:49,227]    INFO Filtering with bustools
[2021-03-29 12:20:49,227]    INFO Generating whitelist ../Data/kallisto_align_F1/filter_barcodes.txt from BUS file ../Data/kallisto_align_F1/output.unfiltered.bus
[2021-03-29 12:20:50,233]    INFO Correcting BUS records in ../Data/kallisto_align_F1/output.unfiltered.bus to ../Data/kallisto_align_F1/tmp/output.unfiltered.c.bus with whitelist ../Data/kallisto_align_F1/filter_barcodes.txt
[2021-03-29 12:21:14,047]    INFO Sorting BUS file ../Data/kallisto_align_F1/tmp/output.unfiltered.c.bus to ../Data/kallisto_align_F1/output.filtered.bus
[2021-03-29 12:21:43,460]    INFO Generating count matrix ../Data/kallisto_align_F1/counts_filtered/cells_x_genes from BUS file ../Data/kallisto_align_F1/output.filtered.bus
[2021-03-29 12:22:15,664]    INFO Reading matrix ../Data/kallisto_align_F1/counts_filtered/cells_x_genes.mtx
[2021-03-29 12:22:31,402]    INFO Writing matrix to h5ad ../Data/kallisto_align_F1/counts_filtered/adata.h5ad
... storing 'gene_name' as categorical
!kb count --h5ad -i ../Data/transcriptome.idx \
-g ../Data/transcripts_to_genes.txt -x 10XV3 \
-o ../Data/kallisto_align_F2 --filter bustools --overwrite -t 10 ../Data/CatFiles/F2_R1.fastq.gz ../Data/CatFiles/F2_R2.fastq.gz
[2021-03-29 12:22:33,429]    INFO Using index ../Data/transcriptome.idx to generate BUS file to ../Data/kallisto_align_F2 from
[2021-03-29 12:22:33,429]    INFO         ../Data/CatFiles/F2_R1.fastq.gz
[2021-03-29 12:22:33,429]    INFO         ../Data/CatFiles/F2_R2.fastq.gz
[2021-03-29 12:27:43,257]    INFO Sorting BUS file ../Data/kallisto_align_F2/output.bus to ../Data/kallisto_align_F2/tmp/output.s.bus
[2021-03-29 12:28:30,055]    INFO Whitelist not provided
[2021-03-29 12:28:30,055]    INFO Copying pre-packaged 10XV3 whitelist to ../Data/kallisto_align_F2
[2021-03-29 12:28:30,620]    INFO Inspecting BUS file ../Data/kallisto_align_F2/tmp/output.s.bus
[2021-03-29 12:28:59,069]    INFO Correcting BUS records in ../Data/kallisto_align_F2/tmp/output.s.bus to ../Data/kallisto_align_F2/tmp/output.s.c.bus with whitelist ../Data/kallisto_align_F2/10xv3_whitelist.txt
[2021-03-29 12:29:27,351]    INFO Sorting BUS file ../Data/kallisto_align_F2/tmp/output.s.c.bus to ../Data/kallisto_align_F2/output.unfiltered.bus
[2021-03-29 12:29:55,576]    INFO Generating count matrix ../Data/kallisto_align_F2/counts_unfiltered/cells_x_genes from BUS file ../Data/kallisto_align_F2/output.unfiltered.bus
[2021-03-29 12:30:33,051]    INFO Reading matrix ../Data/kallisto_align_F2/counts_unfiltered/cells_x_genes.mtx
[2021-03-29 12:30:53,474]    INFO Writing matrix to h5ad ../Data/kallisto_align_F2/counts_unfiltered/adata.h5ad
/Users/emmanueldollinger/miniconda3/lib/python3.7/site-packages/anndata/_core/anndata.py:1192: FutureWarning: is_categorical is deprecated and will be removed in a future version.  Use is_categorical_dtype instead
  if is_string_dtype(df[key]) and not is_categorical(df[key])
... storing 'gene_name' as categorical
[2021-03-29 12:30:54,842]    INFO Filtering with bustools
[2021-03-29 12:30:54,842]    INFO Generating whitelist ../Data/kallisto_align_F2/filter_barcodes.txt from BUS file ../Data/kallisto_align_F2/output.unfiltered.bus
[2021-03-29 12:30:55,564]    INFO Correcting BUS records in ../Data/kallisto_align_F2/output.unfiltered.bus to ../Data/kallisto_align_F2/tmp/output.unfiltered.c.bus with whitelist ../Data/kallisto_align_F2/filter_barcodes.txt
[2021-03-29 12:31:11,453]    INFO Sorting BUS file ../Data/kallisto_align_F2/tmp/output.unfiltered.c.bus to ../Data/kallisto_align_F2/output.filtered.bus
[2021-03-29 12:31:30,731]    INFO Generating count matrix ../Data/kallisto_align_F2/counts_filtered/cells_x_genes from BUS file ../Data/kallisto_align_F2/output.filtered.bus
[2021-03-29 12:31:48,377]    INFO Reading matrix ../Data/kallisto_align_F2/counts_filtered/cells_x_genes.mtx
[2021-03-29 12:31:56,373]    INFO Writing matrix to h5ad ../Data/kallisto_align_F2/counts_filtered/adata.h5ad
... storing 'gene_name' as categorical
Part 3: Comparison
Load all of the data.
import chunk
import os
import pandas as pd
import scanpy as sc
import warnings
warnings.simplefilter(action='ignore', category=FutureWarning)

import seaborn as sns
import matplotlib.pyplot as plt
import numpy as np
F1_cellranger =  sc.read_10x_h5('../Data/raw_feature_bc_matrixF1.h5')
F1_cellranger.var_names_make_unique()

F2_cellranger =  sc.read_10x_h5('../Data/raw_feature_bc_matrixF2.h5')
F2_cellranger.var_names_make_unique()
Variable names are not unique. To make them unique, call `.var_names_make_unique`.
Variable names are not unique. To make them unique, call `.var_names_make_unique`.
Variable names are not unique. To make them unique, call `.var_names_make_unique`.
Variable names are not unique. To make them unique, call `.var_names_make_unique`.
F1_kallisto = sc.read_h5ad('../Data/kallisto_align_F1/counts_unfiltered/adata.h5ad')
F1_kallisto.var_names_make_unique()

F2_kallisto = sc.read_h5ad('../Data/kallisto_align_F2/counts_unfiltered/adata.h5ad')
F2_kallisto.var_names_make_unique()
Clean up kallisto gene names.
F1_kallisto.var['gene_name'] = F1_kallisto.var['gene_name'].astype(str)
F2_kallisto.var['gene_name'] = F2_kallisto.var['gene_name'].astype(str)
F1_kallisto.var.set_index('gene_name', inplace = True)
F2_kallisto.var.set_index('gene_name', inplace = True)
F1_kallisto.var_names_make_unique()
F2_kallisto.var_names_make_unique()
First, let’s filter genes per cell and cells per gene:
F1_cellranger
AnnData object with n_obs × n_vars = 6794880 × 53700
    var: 'gene_ids', 'feature_types', 'genome'
ListOfAdata = [F1_cellranger, F1_kallisto, F2_cellranger, F2_kallisto]

for adata in ListOfAdata:

    sc.pp.filter_cells(adata, min_genes=200)
    sc.pp.filter_genes(adata, min_cells=3)
    sc.pp.calculate_qc_metrics(adata, percent_top=None, log1p=False, inplace=True)
F1_cellranger
AnnData object with n_obs × n_vars = 7964 × 21150
    obs: 'n_genes', 'n_genes_by_counts', 'total_counts'
    var: 'gene_ids', 'feature_types', 'genome', 'n_cells', 'n_cells_by_counts', 'mean_counts', 'pct_dropout_by_counts', 'total_counts'
F1_kallisto
AnnData object with n_obs × n_vars = 7977 × 27046
    obs: 'n_genes', 'n_genes_by_counts', 'total_counts'
    var: 'n_cells', 'n_cells_by_counts', 'mean_counts', 'pct_dropout_by_counts', 'total_counts'
F2_cellranger
AnnData object with n_obs × n_vars = 5515 × 20220
    obs: 'n_genes', 'n_genes_by_counts', 'total_counts'
    var: 'gene_ids', 'feature_types', 'genome', 'n_cells', 'n_cells_by_counts', 'mean_counts', 'pct_dropout_by_counts', 'total_counts'
F2_kallisto
AnnData object with n_obs × n_vars = 5470 × 25936
    obs: 'n_genes', 'n_genes_by_counts', 'total_counts'
    var: 'n_cells', 'n_cells_by_counts', 'mean_counts', 'pct_dropout_by_counts', 'total_counts'
Save anndatas.
F1_cellranger.write_h5ad('../Data/F1_cellranger.h5ad')
F2_cellranger.write_h5ad('../Data/F2_cellranger.h5ad')
F1_kallisto.write_h5ad('../Data/F1_kallisto.h5ad')
F2_kallisto.write_h5ad('../Data/F2_kallisto.h5ad')
... storing 'feature_types' as categorical
... storing 'genome' as categorical
... storing 'feature_types' as categorical
... storing 'genome' as categorical
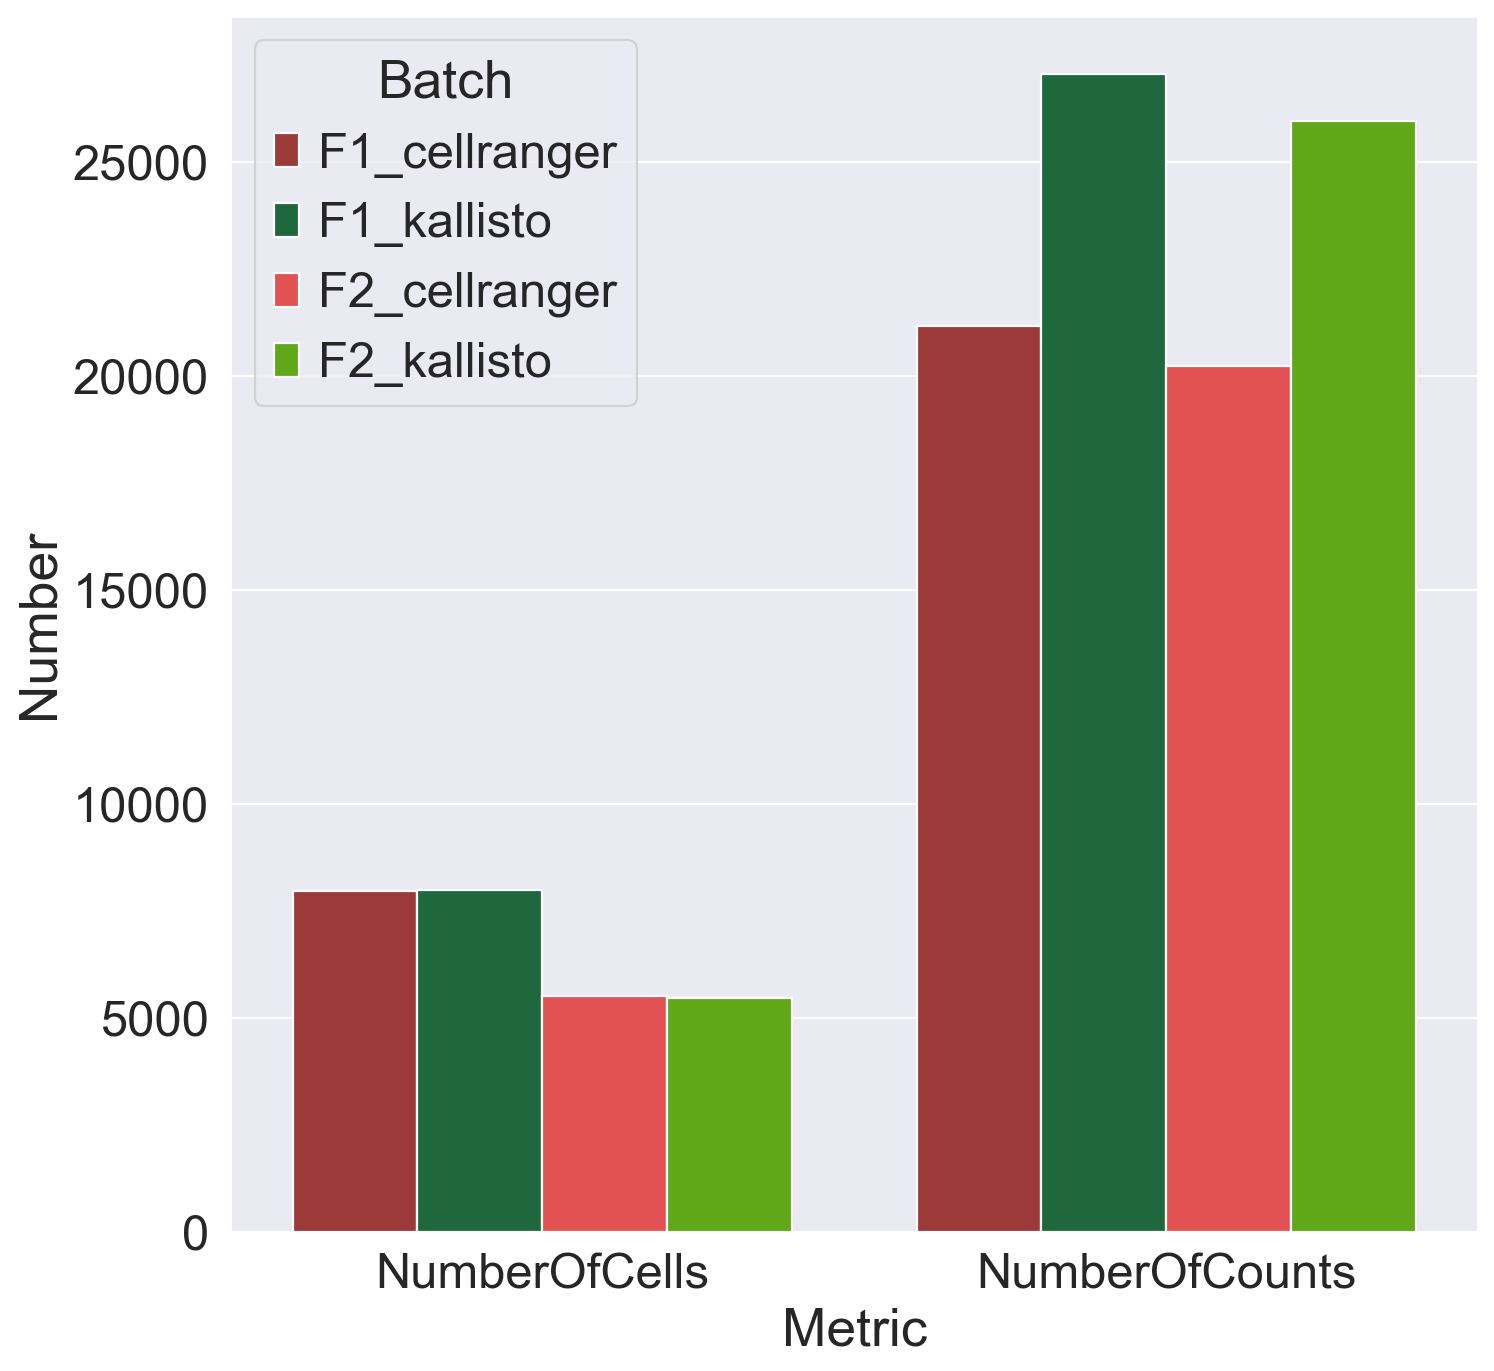
Plot metrics of number of cells and number of counts
dfMetrics = pd.DataFrame()

dfMetrics["Batch"] = np.array([np.repeat(x, 2) for x in np.unique(obs["Batch"])]).flatten()

dfMetrics["Metric"] = np.tile(['NumberOfCells','NumberOfCounts'], 4)

dfMetrics["Number"] = np.array([7960,21150,7977,27046,5512,20220,5470,25936])
plt.figure(figsize=(10, 10))

sns.set(font_scale=2)

fig = sns.barplot(data = dfMetrics, x = 'Metric', y='Number', hue = 'Batch', palette = ['#ad2828', '#13743c','#fa3a3a','#60c000'], hue_order = ['F1_cellranger','F1_kallisto','F2_cellranger','F2_kallisto'])

# plt.xscale("log")
# plt.xlabel("Total counts of transcriptic counts per cell.")

plt.savefig('/Users/emmanueldollinger/Desktop/Metrics.pdf', dpi=300, transparent = False)
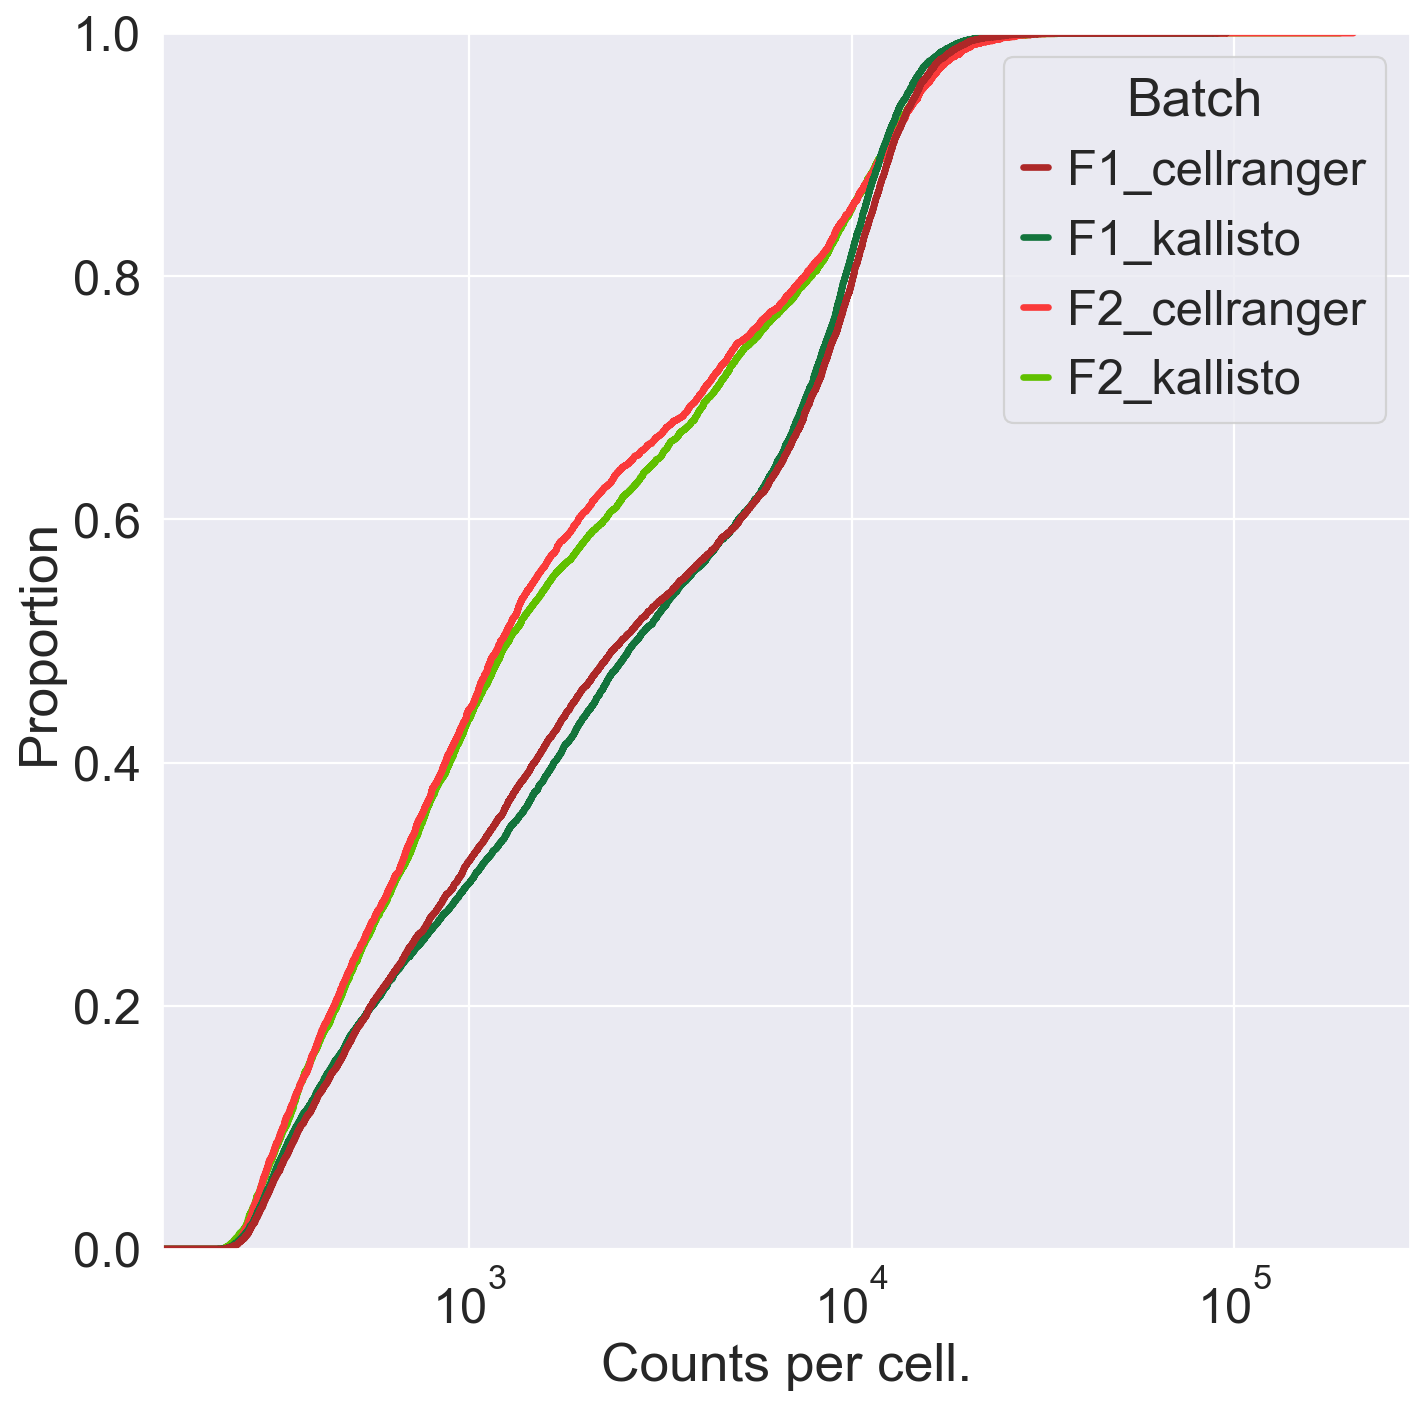
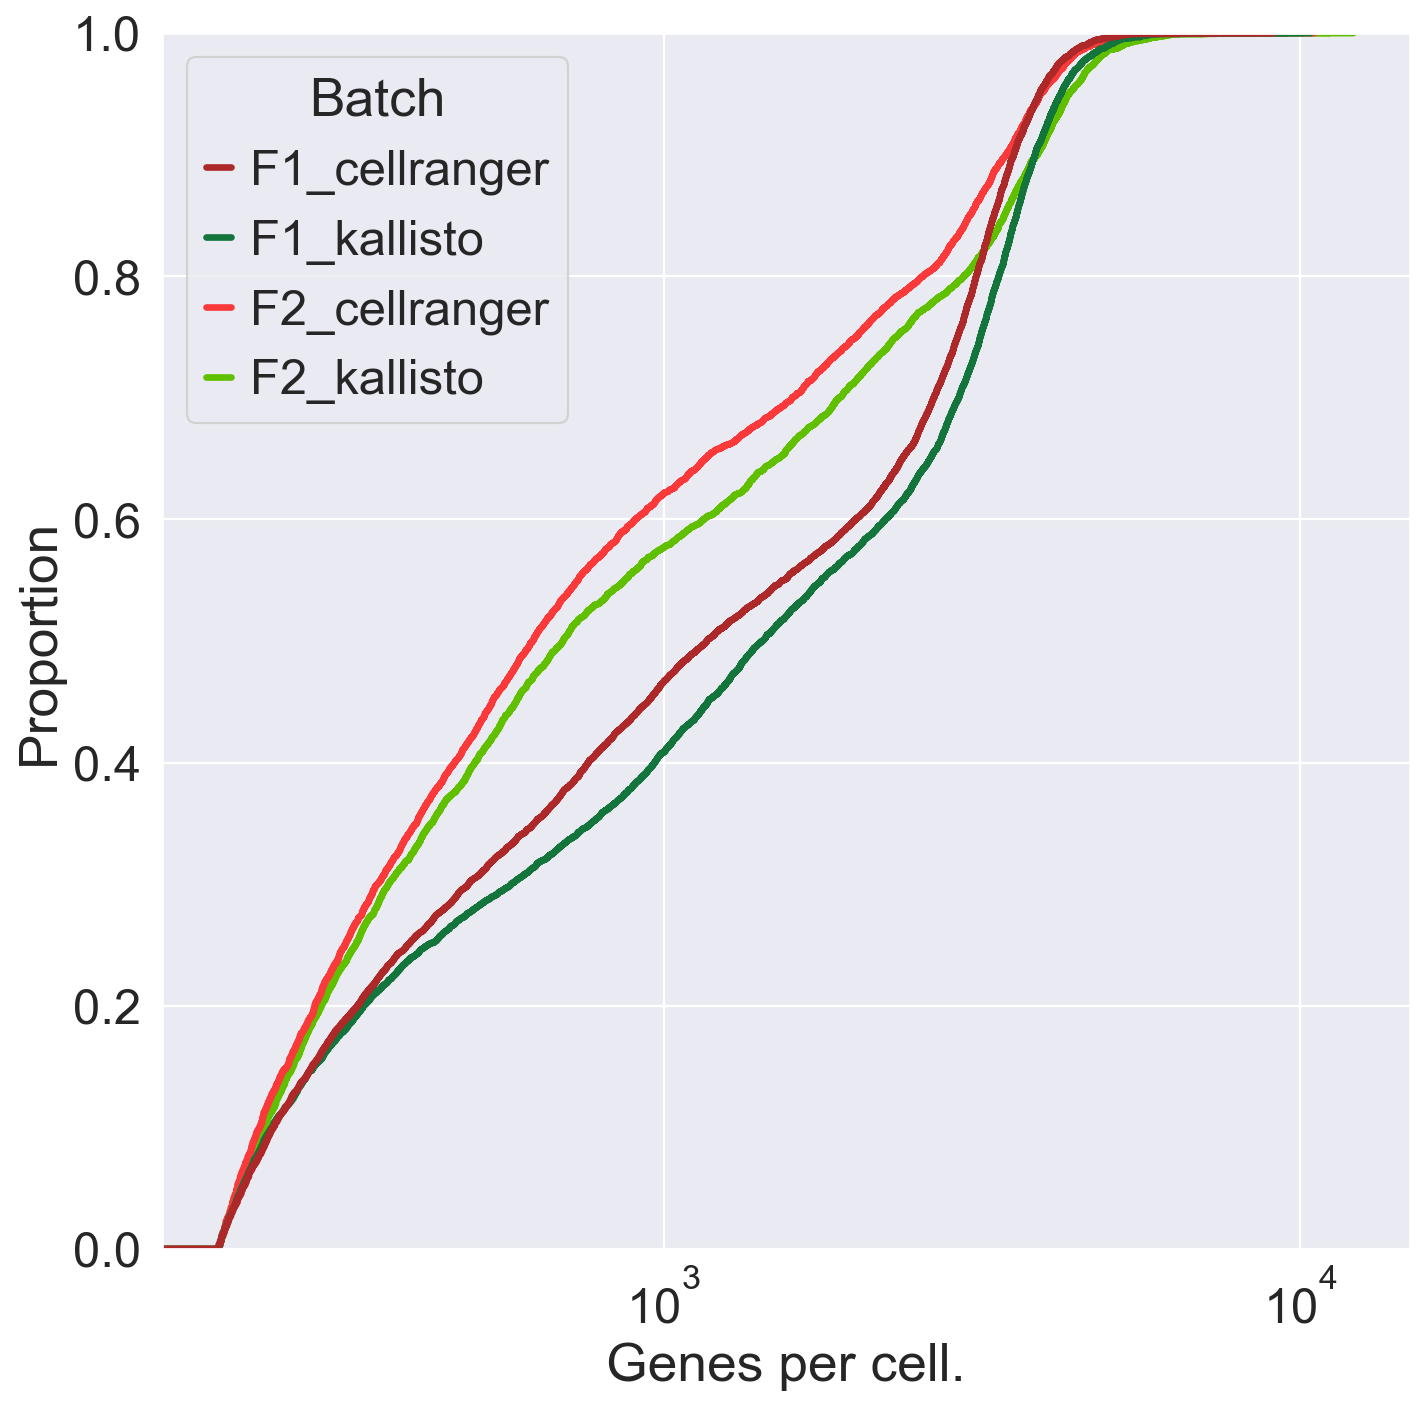
Plot transcripts/cell and genes/cell
F1_cellranger.obs['Mouse'] = 'F1'
F1_cellranger.obs['Aligner'] = 'cellranger'

F2_cellranger.obs['Mouse'] = 'F2'
F2_cellranger.obs['Aligner'] = 'cellranger'

F1_kallisto.obs['Mouse'] = 'F1'
F1_kallisto.obs['Aligner'] = 'kallisto'

F2_kallisto.obs['Mouse'] = 'F2'
F2_kallisto.obs['Aligner'] = 'kallisto'
obs = F1_cellranger.obs
obs = obs.append(F2_cellranger.obs)
obs = obs.append(F1_kallisto.obs)
obs = obs.append(F2_kallisto.obs)
obs
| n_genes | n_genes_by_counts | total_counts | Mouse | Aligner | |
|---|---|---|---|---|---|
| AAACCCAAGATGGGCT-1 | 250 | 250 | 444.0 | F1 | cellranger |
| AAACCCAAGCTCGTGC-1 | 2244 | 2244 | 6383.0 | F1 | cellranger |
| AAACCCACAATCTAGC-1 | 4334 | 4330 | 21088.0 | F1 | cellranger |
| AAACCCACAGTTGAAA-1 | 227 | 227 | 568.0 | F1 | cellranger |
| AAACCCACATGGGAAC-1 | 757 | 757 | 1291.0 | F1 | cellranger |
| ... | ... | ... | ... | ... | ... |
| TTTGTTGCAAGAAACT | 414 | 414 | 1021.0 | F2 | kallisto |
| TTTGTTGCATGCCGGT | 342 | 342 | 413.0 | F2 | kallisto |
| TTTGTTGGTCAAAGAT | 2259 | 2259 | 5094.0 | F2 | kallisto |
| TTTGTTGGTGTTTACG | 5749 | 5743 | 23113.0 | F2 | kallisto |
| TTTGTTGTCACTTTGT | 1591 | 1588 | 3226.0 | F2 | kallisto |
26926 rows × 5 columns
obs["Batch"] = obs["Mouse"] + '_' + obs["Aligner"]
plt.figure(figsize=(10, 10))
sns.set(font_scale=2)

fig = sns.ecdfplot(data = obs, x = 'total_counts', hue = 'Batch', palette = ['#ad2828', '#13743c','#fa3a3a','#60c000'], hue_order = ['F1_cellranger','F1_kallisto','F2_cellranger','F2_kallisto'], linewidth = 3)

plt.xscale("log")
plt.xlabel("Counts per cell.")

plt.savefig('/Users/emmanueldollinger/Desktop/CountsPerCell.pdf', dpi=300, transparent = False)
plt.figure(figsize=(10, 10))
sns.set(font_scale=2)

fig = sns.ecdfplot(data = obs, x = 'n_genes', hue = 'Batch', palette = ['#ad2828', '#13743c','#fa3a3a','#60c000'], hue_order = ['F1_cellranger','F1_kallisto','F2_cellranger','F2_kallisto'], linewidth = 3)

plt.xscale("log")
plt.xlabel("Genes per cell.")

plt.savefig('/Users/emmanueldollinger/Desktop/GenesPerCell.pdf', dpi=300, transparent = False)
040121
Now, let’s ask the question if we look at the union of the genes, how do the clusters change? No batch correction.
F1_cellranger.obs["Batch"] = F1_cellranger.obs["Mouse"].values + '_' + F1_cellranger.obs["Aligner"].values

F1_kallisto.obs["Batch"] = F1_kallisto.obs["Mouse"].values + '_' + F1_kallisto.obs["Aligner"].values

F2_cellranger.obs["Batch"] = F2_cellranger.obs["Mouse"].values + '_' + F2_cellranger.obs["Aligner"].values

F2_kallisto.obs["Batch"] = F2_kallisto.obs["Mouse"].values + '_' + F2_kallisto.obs["Aligner"].values
del AllCells
AllCells = F1_cellranger.concatenate(F1_kallisto, F2_cellranger, F2_kallisto)
AllCells
AnnData object with n_obs × n_vars = 26926 × 19093
    obs: 'n_genes', 'n_genes_by_counts', 'total_counts', 'Mouse', 'Aligner', 'Batch', 'batch'
    var: 'gene_ids-0', 'feature_types-0', 'genome-0', 'n_cells-0', 'n_cells_by_counts-0', 'mean_counts-0', 'pct_dropout_by_counts-0', 'total_counts-0', 'n_cells-1', 'n_cells_by_counts-1', 'mean_counts-1', 'pct_dropout_by_counts-1', 'total_counts-1', 'gene_ids-2', 'feature_types-2', 'genome-2', 'n_cells-2', 'n_cells_by_counts-2', 'mean_counts-2', 'pct_dropout_by_counts-2', 'total_counts-2', 'n_cells-3', 'n_cells_by_counts-3', 'mean_counts-3', 'pct_dropout_by_counts-3', 'total_counts-3'
As opposed to the scanpy docs, I store the counts in raw (not the log1p transformed counts).
AllCells.raw = AllCells
Filter mt cells.
AllCells.var['mt'] = AllCells.var_names.str.startswith('MT-')  # annotate the group of mitochondrial genes as 'mt'
sc.pp.calculate_qc_metrics(AllCells, qc_vars=['mt'], percent_top=None, log1p=False, inplace=True)
AllCells = AllCells[AllCells.obs.pct_counts_mt < 5, :]
Typical preprocessing.
AllCells
View of AnnData object with n_obs × n_vars = 26926 × 19093
    obs: 'n_genes', 'n_genes_by_counts', 'total_counts', 'Mouse', 'Aligner', 'Batch', 'batch', 'total_counts_mt', 'pct_counts_mt'
    var: 'gene_ids-0', 'feature_types-0', 'genome-0', 'n_cells-0', 'n_cells_by_counts-0', 'mean_counts-0', 'pct_dropout_by_counts-0', 'total_counts-0', 'n_cells-1', 'n_cells_by_counts-1', 'mean_counts-1', 'pct_dropout_by_counts-1', 'total_counts-1', 'gene_ids-2', 'feature_types-2', 'genome-2', 'n_cells-2', 'n_cells_by_counts-2', 'mean_counts-2', 'pct_dropout_by_counts-2', 'total_counts-2', 'n_cells-3', 'n_cells_by_counts-3', 'mean_counts-3', 'pct_dropout_by_counts-3', 'total_counts-3', 'mt', 'n_cells_by_counts', 'mean_counts', 'pct_dropout_by_counts', 'total_counts'
sc.pp.normalize_total(AllCells, target_sum=1e4)
sc.pp.log1p(AllCells)

sc.pp.highly_variable_genes(AllCells, min_mean=0.0125, max_mean=3, min_disp=0.5)
sc.pp.scale(AllCells, max_value=10)
/Users/emmanueldollinger/miniconda3/lib/python3.7/site-packages/scanpy/preprocessing/_normalization.py:138: UserWarning: Revieved a view of an AnnData. Making a copy.
  view_to_actual(adata)
sc.tl.pca(AllCells, svd_solver='arpack')
sc.pp.neighbors(AllCells, n_neighbors=10, n_pcs=40, metric='cosine')
sc.tl.umap(AllCells)
sc.settings.set_figure_params(dpi=80, facecolor='white', figsize=(10,10))
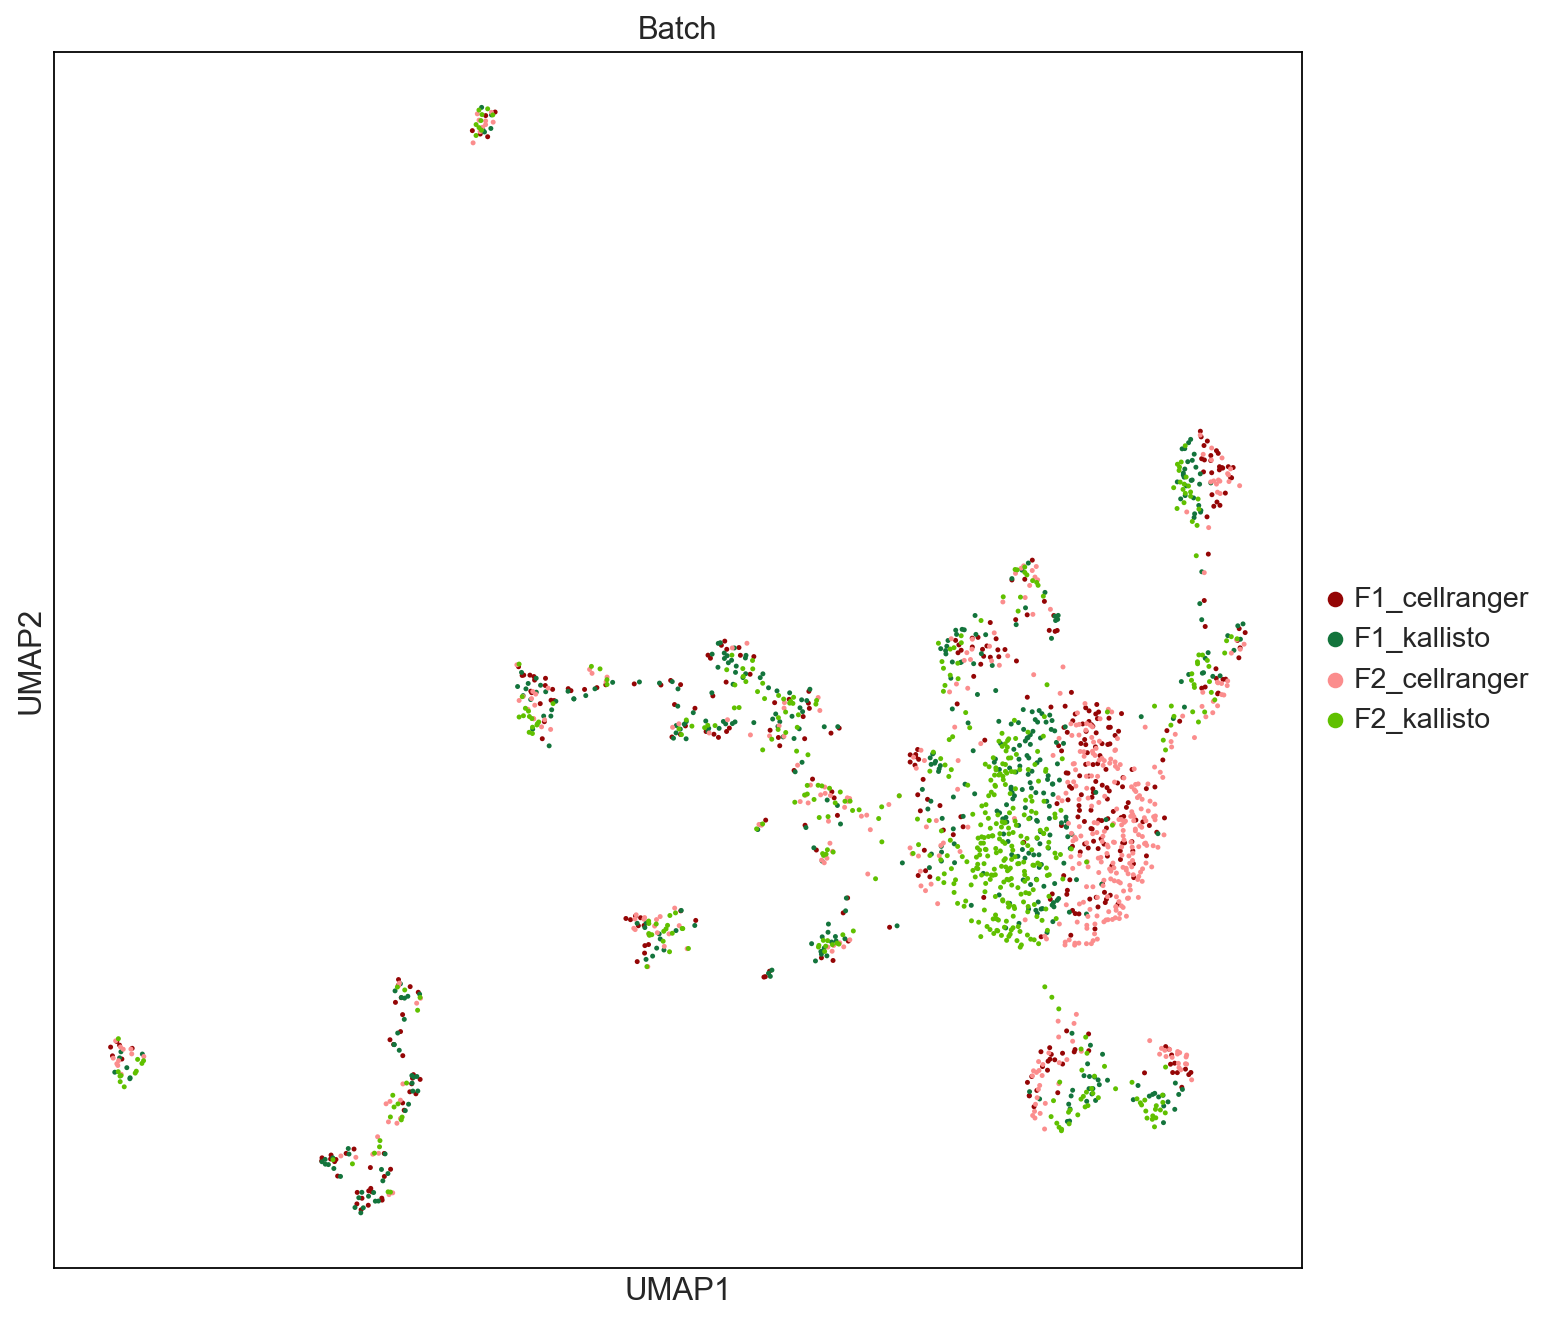
fig = sc.pl.umap(AllCells, color=['Batch'], palette = ['#940505', '#13743c','#fb8d8d','#60c000'], size = 10, save = 'UMAPbyBatch.pdf') #ad2828
WARNING: saving figure to file figures/umapUMAPbyBatch.pdf
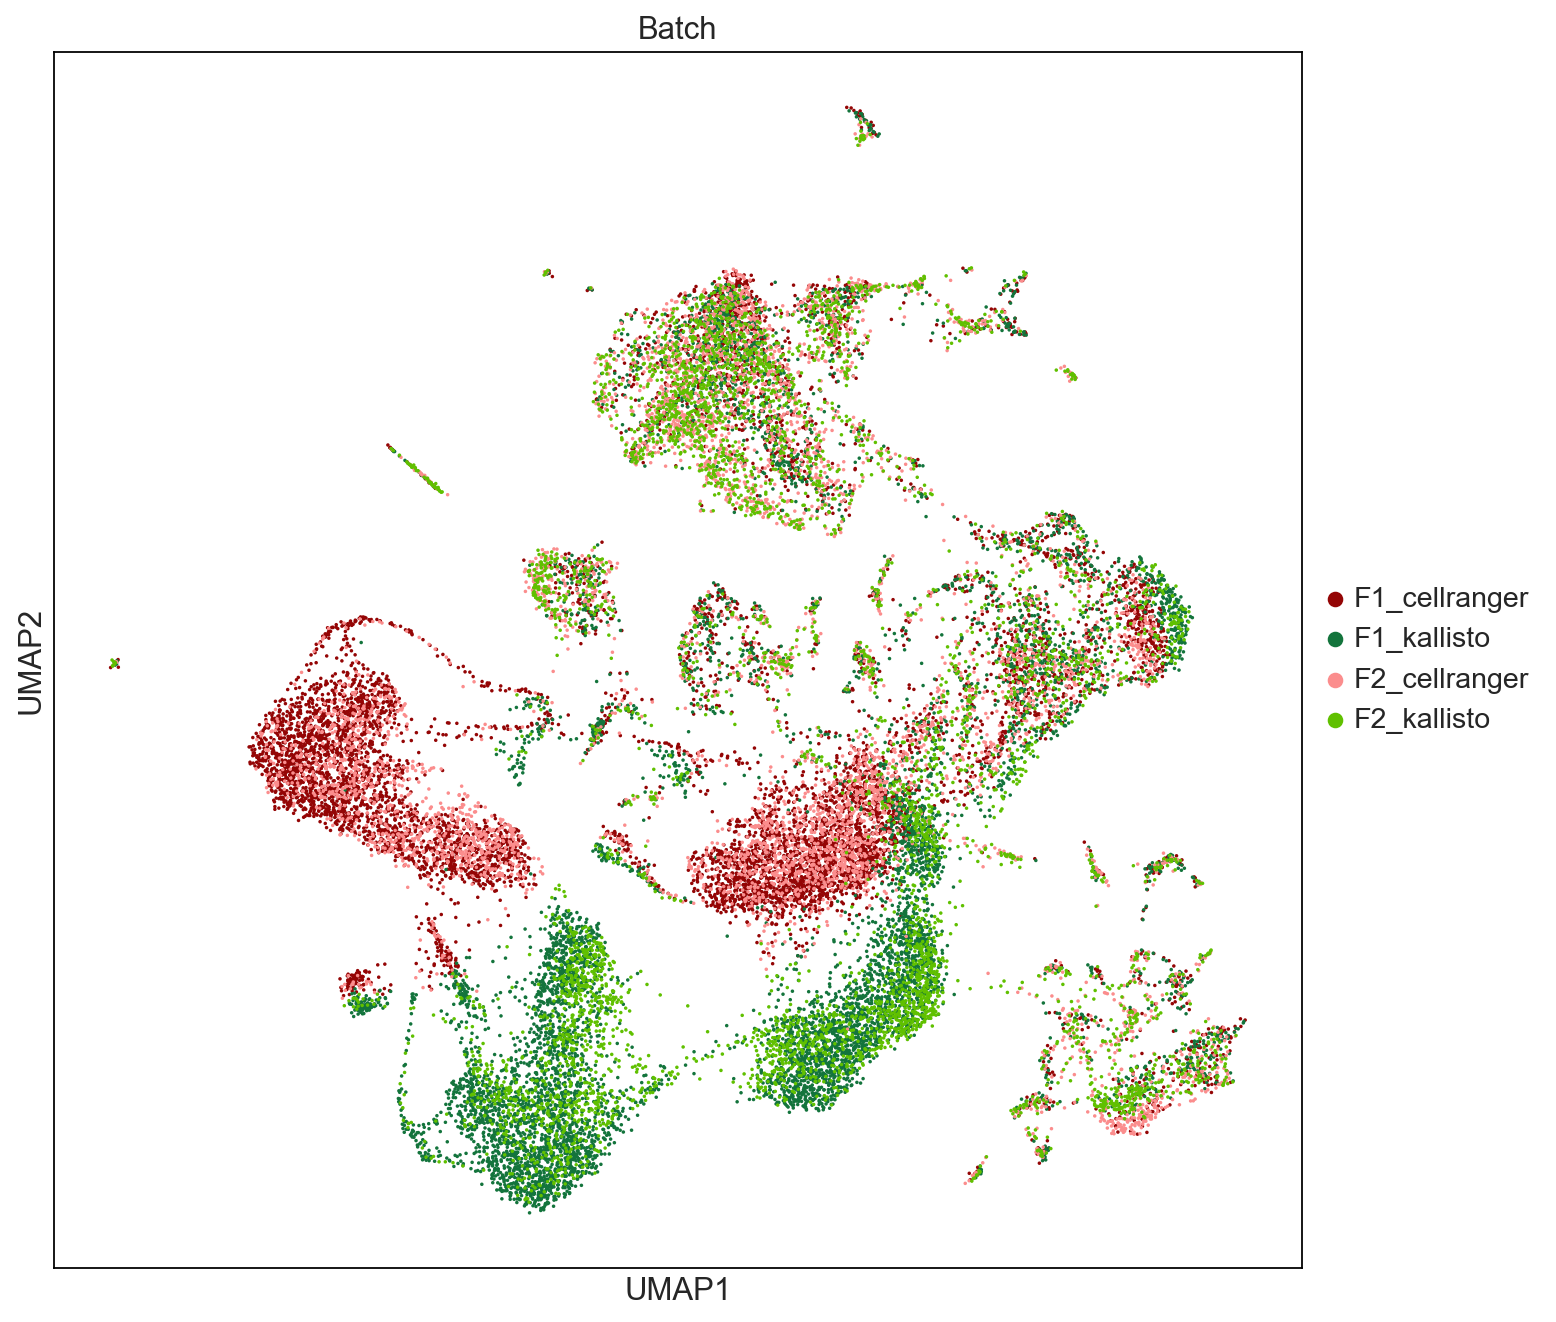
This is probably due to # of transcripts, AnnData concat does the intersection of genes.
?ad.AnnData.concatenate
[0;31mSignature:[0m
[0mad[0m[0;34m.[0m[0mAnnData[0m[0;34m.[0m[0mconcatenate[0m[0;34m([0m[0;34m[0m
[0;34m[0m [0mself[0m[0;34m,[0m[0;34m[0m
[0;34m[0m [0;34m*[0m[0madatas[0m[0;34m:[0m [0;34m'AnnData'[0m[0;34m,[0m[0;34m[0m
[0;34m[0m [0mjoin[0m[0;34m:[0m [0mstr[0m [0;34m=[0m [0;34m'inner'[0m[0;34m,[0m[0;34m[0m
[0;34m[0m [0mbatch_key[0m[0;34m:[0m [0mstr[0m [0;34m=[0m [0;34m'batch'[0m[0;34m,[0m[0;34m[0m
[0;34m[0m [0mbatch_categories[0m[0;34m:[0m [0mSequence[0m[0;34m[[0m[0mAny[0m[0;34m][0m [0;34m=[0m [0;32mNone[0m[0;34m,[0m[0;34m[0m
[0;34m[0m [0muns_merge[0m[0;34m:[0m [0mUnion[0m[0;34m[[0m[0mstr[0m[0;34m,[0m [0mNoneType[0m[0;34m][0m [0;34m=[0m [0;32mNone[0m[0;34m,[0m[0;34m[0m
[0;34m[0m [0mindex_unique[0m[0;34m:[0m [0mUnion[0m[0;34m[[0m[0mstr[0m[0;34m,[0m [0mNoneType[0m[0;34m][0m [0;34m=[0m [0;34m'-'[0m[0;34m,[0m[0;34m[0m
[0;34m[0m [0mfill_value[0m[0;34m=[0m[0;32mNone[0m[0;34m,[0m[0;34m[0m
[0;34m[0m[0;34m)[0m [0;34m->[0m [0;34m'AnnData'[0m[0;34m[0m[0;34m[0m[0m
[0;31mDocstring:[0m
Concatenate along the observations axis.
The :attr:`uns`, :attr:`varm` and :attr:`obsm` attributes are ignored.
Currently, this works only in `'memory'` mode.
Parameters
----------
adatas
AnnData matrices to concatenate with. Each matrix is referred to as
a “batch”.
join
Use intersection (`'inner'`) or union (`'outer'`) of variables.
batch_key
Add the batch annotation to :attr:`obs` using this key.
batch_categories
Use these as categories for the batch annotation. By default, use increasing numbers.
uns_merge
Strategy to use for merging entries of uns. These strategies are applied recusivley.
Currently implemented strategies include:
* `None`: The default. The concatenated object will just have an empty dict for `uns`.
* `"same"`: Only entries which have the same value in all AnnData objects are kept.
* `"unique"`: Only entries which have one unique value in all AnnData objects are kept.
* `"first"`: The first non-missing value is used.
* `"only"`: A value is included if only one of the AnnData objects has a value at this
path.
index_unique
Make the index unique by joining the existing index names with the
batch category, using `index_unique='-'`, for instance. Provide
`None` to keep existing indices.
fill_value
Scalar value to fill newly missing values in arrays with. Note: only applies to arrays
and sparse matrices (not dataframes) and will only be used if `join="outer"`.
.. note::
If not provided, the default value is `0` for sparse matrices and `np.nan`
for numpy arrays. See the examples below for more information.
Returns
-------
:class:`~anndata.AnnData`
The concatenated :class:`~anndata.AnnData`, where `adata.obs[batch_key]`
stores a categorical variable labeling the batch.
Notes
-----
.. warning::
If you use `join='outer'` this fills 0s for sparse data when
variables are absent in a batch. Use this with care. Dense data is
filled with `NaN`. See the examples.
Examples
--------
Joining on intersection of variables.
>>> adata1 = AnnData(
... np.array([[1, 2, 3], [4, 5, 6]]),
... dict(obs_names=['s1', 's2'], anno1=['c1', 'c2']),
... dict(var_names=['a', 'b', 'c'], annoA=[0, 1, 2]),
... )
>>> adata2 = AnnData(
... np.array([[1, 2, 3], [4, 5, 6]]),
... dict(obs_names=['s3', 's4'], anno1=['c3', 'c4']),
... dict(var_names=['d', 'c', 'b'], annoA=[0, 1, 2]),
... )
>>> adata3 = AnnData(
... np.array([[1, 2, 3], [4, 5, 6]]),
... dict(obs_names=['s1', 's2'], anno2=['d3', 'd4']),
... dict(var_names=['d', 'c', 'b'], annoA=[0, 2, 3], annoB=[0, 1, 2]),
... )
>>> adata = adata1.concatenate(adata2, adata3)
>>> adata
AnnData object with n_obs × n_vars = 6 × 2
obs: 'anno1', 'anno2', 'batch'
var: 'annoA-0', 'annoA-1', 'annoA-2', 'annoB-2'
>>> adata.X
array([[2., 3.],
[5., 6.],
[3., 2.],
[6., 5.],
[3., 2.],
[6., 5.]], dtype=float32)
>>> adata.obs
anno1 anno2 batch
s1-0 c1 NaN 0
s2-0 c2 NaN 0
s3-1 c3 NaN 1
s4-1 c4 NaN 1
s1-2 NaN d3 2
s2-2 NaN d4 2
>>> adata.var.T
b c
annoA-0 1 2
annoA-1 2 1
annoA-2 3 2
annoB-2 2 1
Joining on the union of variables.
>>> outer = adata1.concatenate(adata2, adata3, join='outer')
>>> outer
AnnData object with n_obs × n_vars = 6 × 4
obs: 'anno1', 'anno2', 'batch'
var: 'annoA-0', 'annoA-1', 'annoA-2', 'annoB-2'
>>> outer.var.T
a b c d
annoA-0 0.0 1.0 2.0 NaN
annoA-1 NaN 2.0 1.0 0.0
annoA-2 NaN 3.0 2.0 0.0
annoB-2 NaN 2.0 1.0 0.0
>>> outer.var_names
Index(['a', 'b', 'c', 'd'], dtype='object')
>>> outer.X
array([[ 1., 2., 3., nan],
[ 4., 5., 6., nan],
[nan, 3., 2., 1.],
[nan, 6., 5., 4.],
[nan, 3., 2., 1.],
[nan, 6., 5., 4.]], dtype=float32)
>>> outer.X.sum(axis=0)
array([nan, 25., 23., nan], dtype=float32)
>>> import pandas as pd
>>> Xdf = pd.DataFrame(outer.X, columns=outer.var_names)
>>> Xdf
a b c d
0 1.0 2.0 3.0 NaN
1 4.0 5.0 6.0 NaN
2 NaN 3.0 2.0 1.0
3 NaN 6.0 5.0 4.0
4 NaN 3.0 2.0 1.0
5 NaN 6.0 5.0 4.0
>>> Xdf.sum()
a 5.0
b 25.0
c 23.0
d 10.0
dtype: float32
One way to deal with missing values is to use masked arrays:
>>> from numpy import ma
>>> outer.X = ma.masked_invalid(outer.X)
>>> outer.X
masked_array(
data=[[1.0, 2.0, 3.0, --],
[4.0, 5.0, 6.0, --],
[--, 3.0, 2.0, 1.0],
[--, 6.0, 5.0, 4.0],
[--, 3.0, 2.0, 1.0],
[--, 6.0, 5.0, 4.0]],
mask=[[False, False, False, True],
[False, False, False, True],
[ True, False, False, False],
[ True, False, False, False],
[ True, False, False, False],
[ True, False, False, False]],
fill_value=1e+20,
dtype=float32)
>>> outer.X.sum(axis=0).data
array([ 5., 25., 23., 10.], dtype=float32)
The masked array is not saved but has to be reinstantiated after saving.
>>> outer.write('./test.h5ad')
>>> from anndata import read_h5ad
>>> outer = read_h5ad('./test.h5ad')
>>> outer.X
array([[ 1., 2., 3., nan],
[ 4., 5., 6., nan],
[nan, 3., 2., 1.],
[nan, 6., 5., 4.],
[nan, 3., 2., 1.],
[nan, 6., 5., 4.]], dtype=float32)
For sparse data, everything behaves similarly,
except that for `join='outer'`, zeros are added.
>>> from scipy.sparse import csr_matrix
>>> adata1 = AnnData(
... csr_matrix([[0, 2, 3], [0, 5, 6]]),
... dict(obs_names=['s1', 's2'], anno1=['c1', 'c2']),
... dict(var_names=['a', 'b', 'c']),
... )
>>> adata2 = AnnData(
... csr_matrix([[0, 2, 3], [0, 5, 6]]),
... dict(obs_names=['s3', 's4'], anno1=['c3', 'c4']),
... dict(var_names=['d', 'c', 'b']),
... )
>>> adata3 = AnnData(
... csr_matrix([[1, 2, 0], [0, 5, 6]]),
... dict(obs_names=['s5', 's6'], anno2=['d3', 'd4']),
... dict(var_names=['d', 'c', 'b']),
... )
>>> adata = adata1.concatenate(adata2, adata3, join='outer')
>>> adata.var_names
Index(['a', 'b', 'c', 'd'], dtype='object')
>>> adata.X.toarray()
array([[0., 2., 3., 0.],
[0., 5., 6., 0.],
[0., 3., 2., 0.],
[0., 6., 5., 0.],
[0., 0., 2., 1.],
[0., 6., 5., 0.]], dtype=float32)
[0;31mFile:[0m ~/miniconda3/lib/python3.7/site-packages/anndata/_core/anndata.py
[0;31mType:[0m function
sc.settings.set_figure_params(dpi=80, facecolor='white', figsize=(10,10))
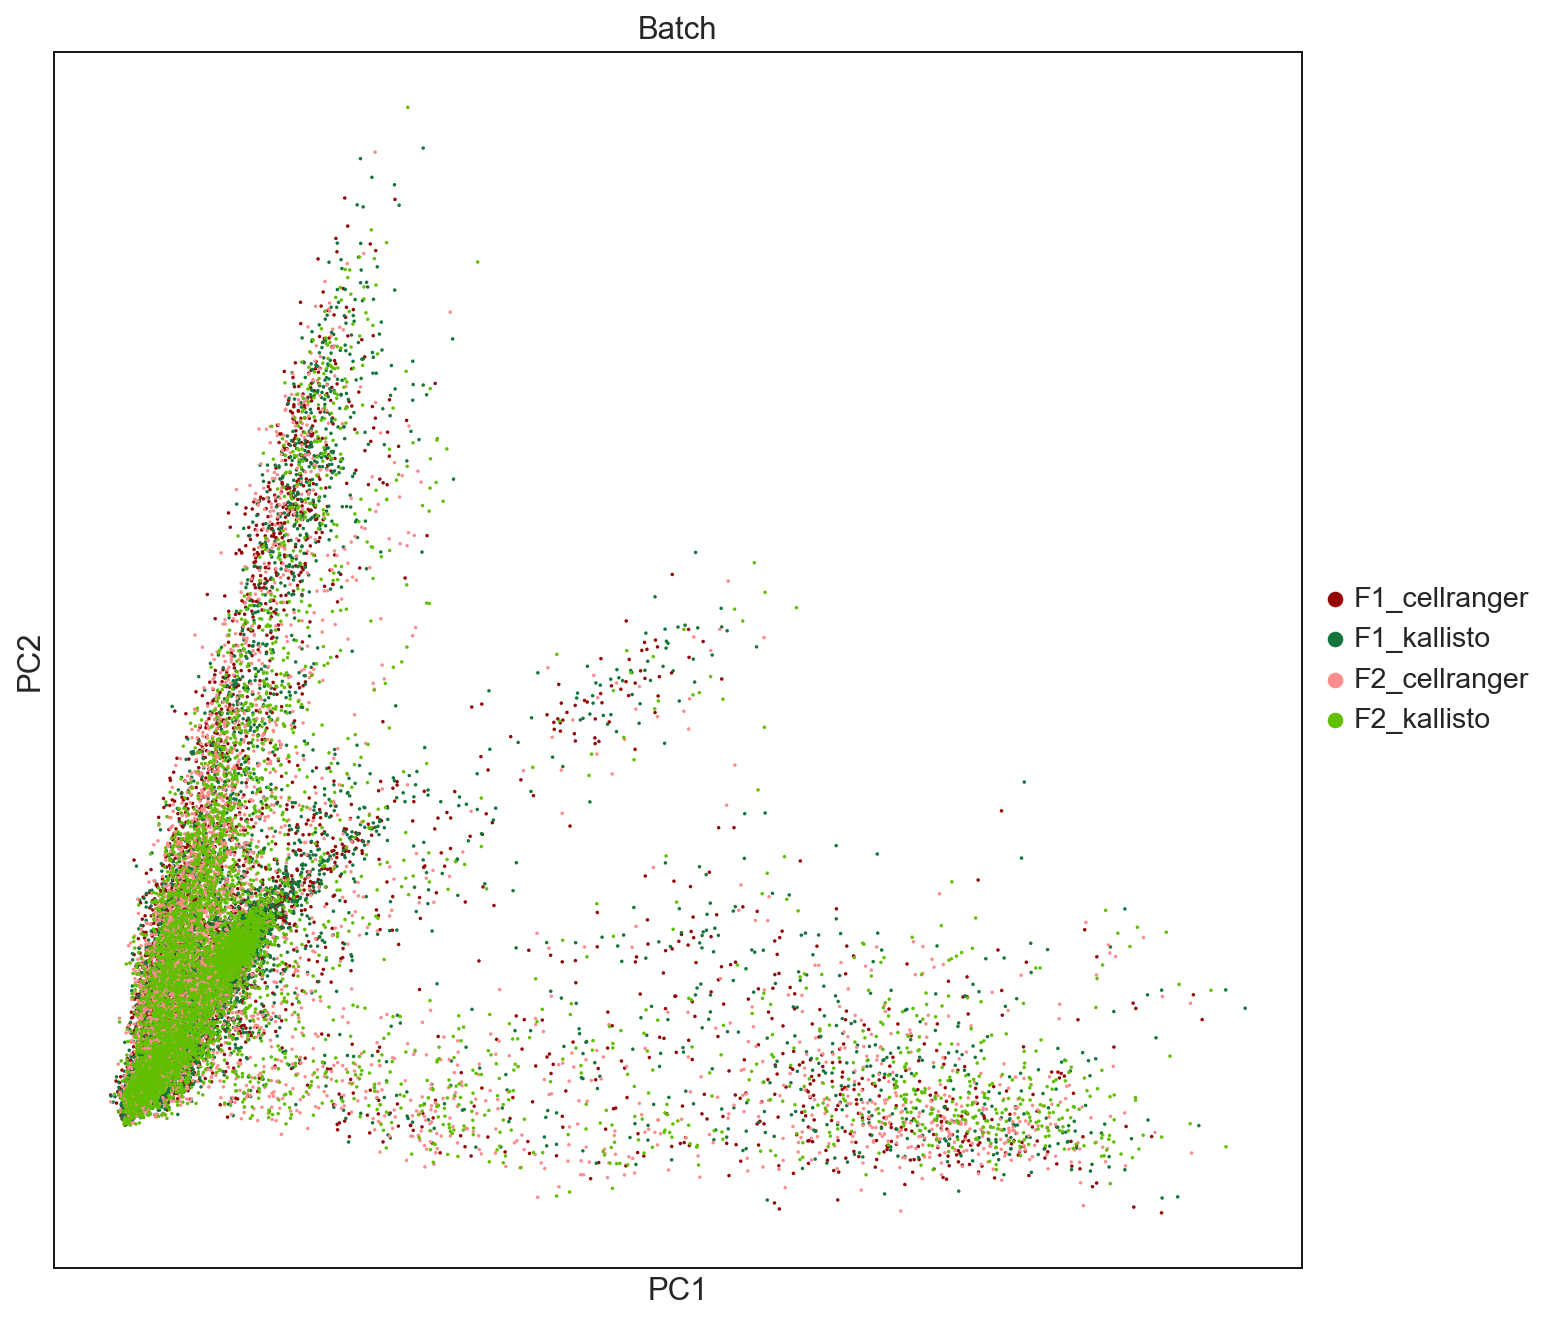
fig = sc.pl.pca(AllCells, color=['Batch'], palette = ['#940505', '#13743c','#fb8d8d','#60c000'], size = 10, save = 'PCAbyBatch.pdf')
WARNING: saving figure to file figures/pcaPCAbyBatch.pdf
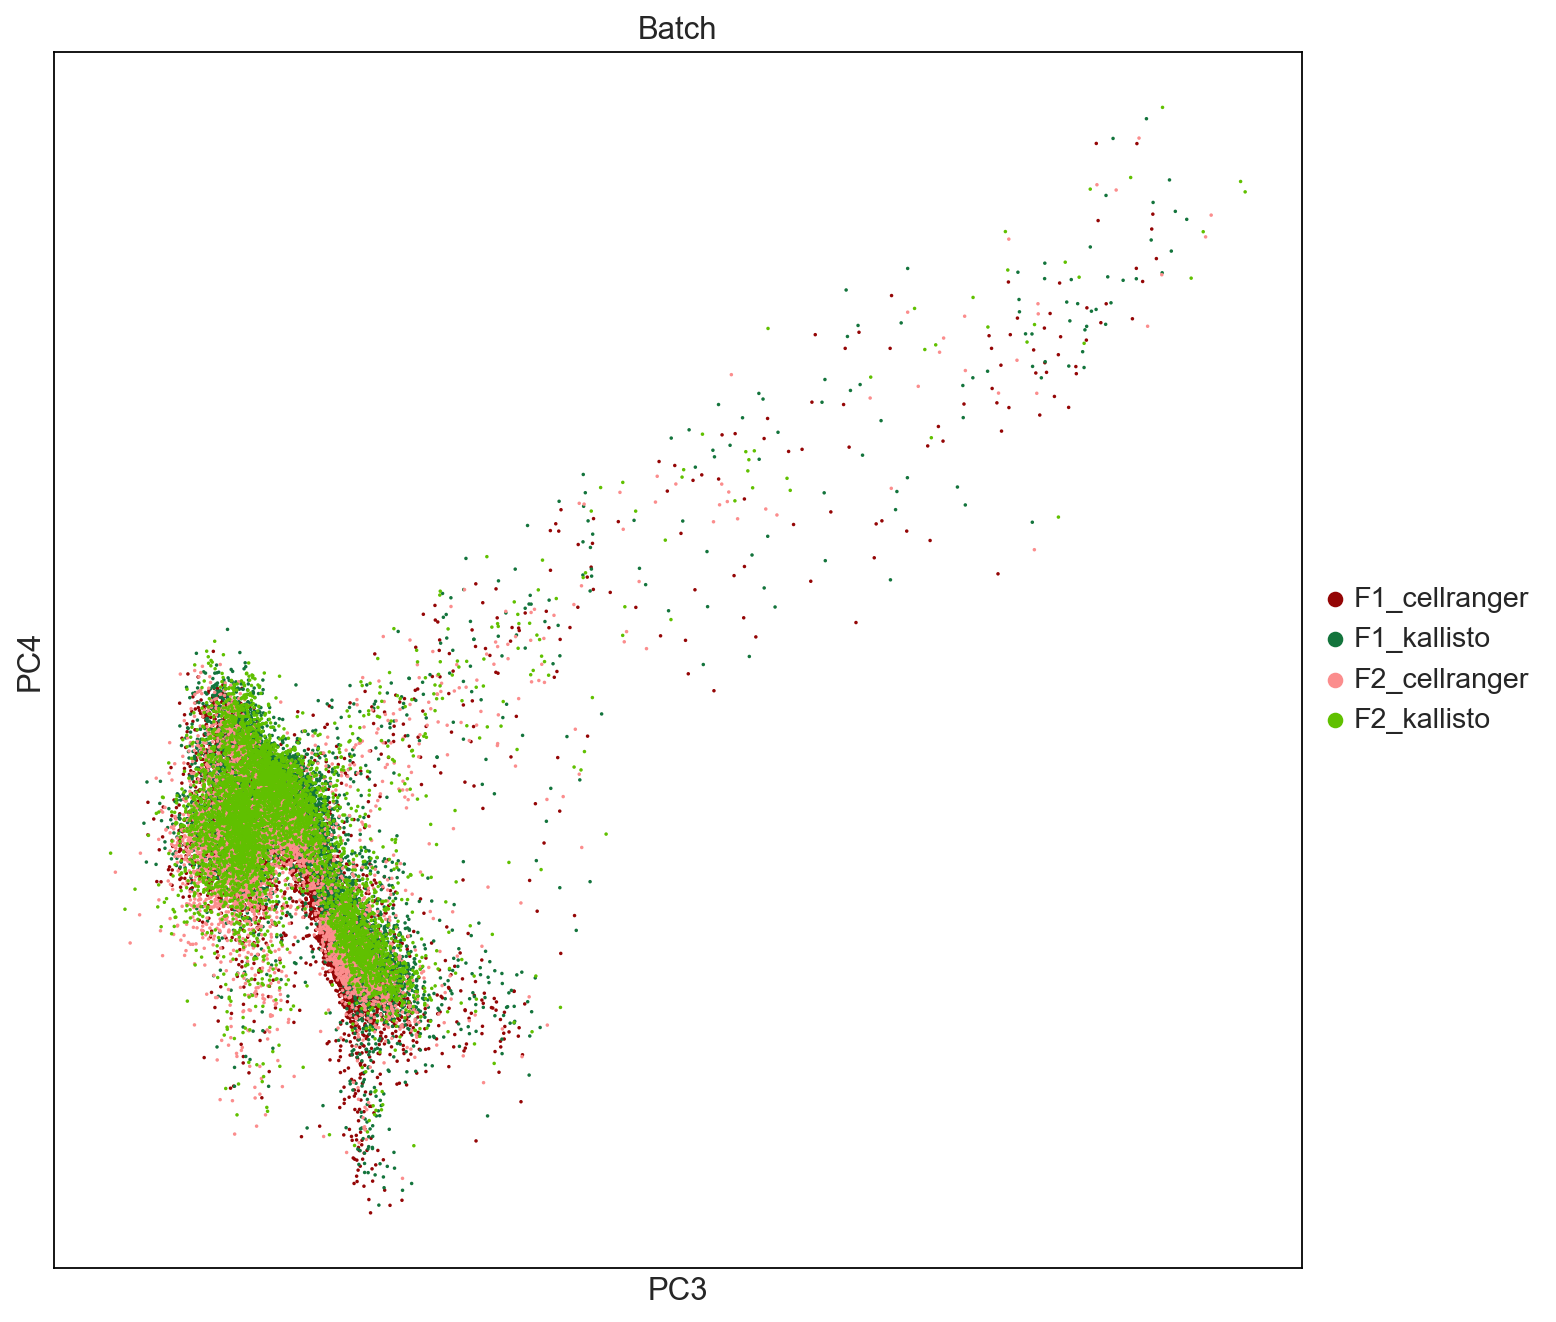
sc.settings.set_figure_params(dpi=80, facecolor='white', figsize=(10,10))
fig = sc.pl.pca(AllCells, color=['Batch'], palette = ['#940505', '#13743c','#fb8d8d','#60c000'], size = 10, save = 'PCAbyBatch34.pdf', components = ['3,4'])
WARNING: saving figure to file figures/pcaPCAbyBatch34.pdf
Cell annotation:
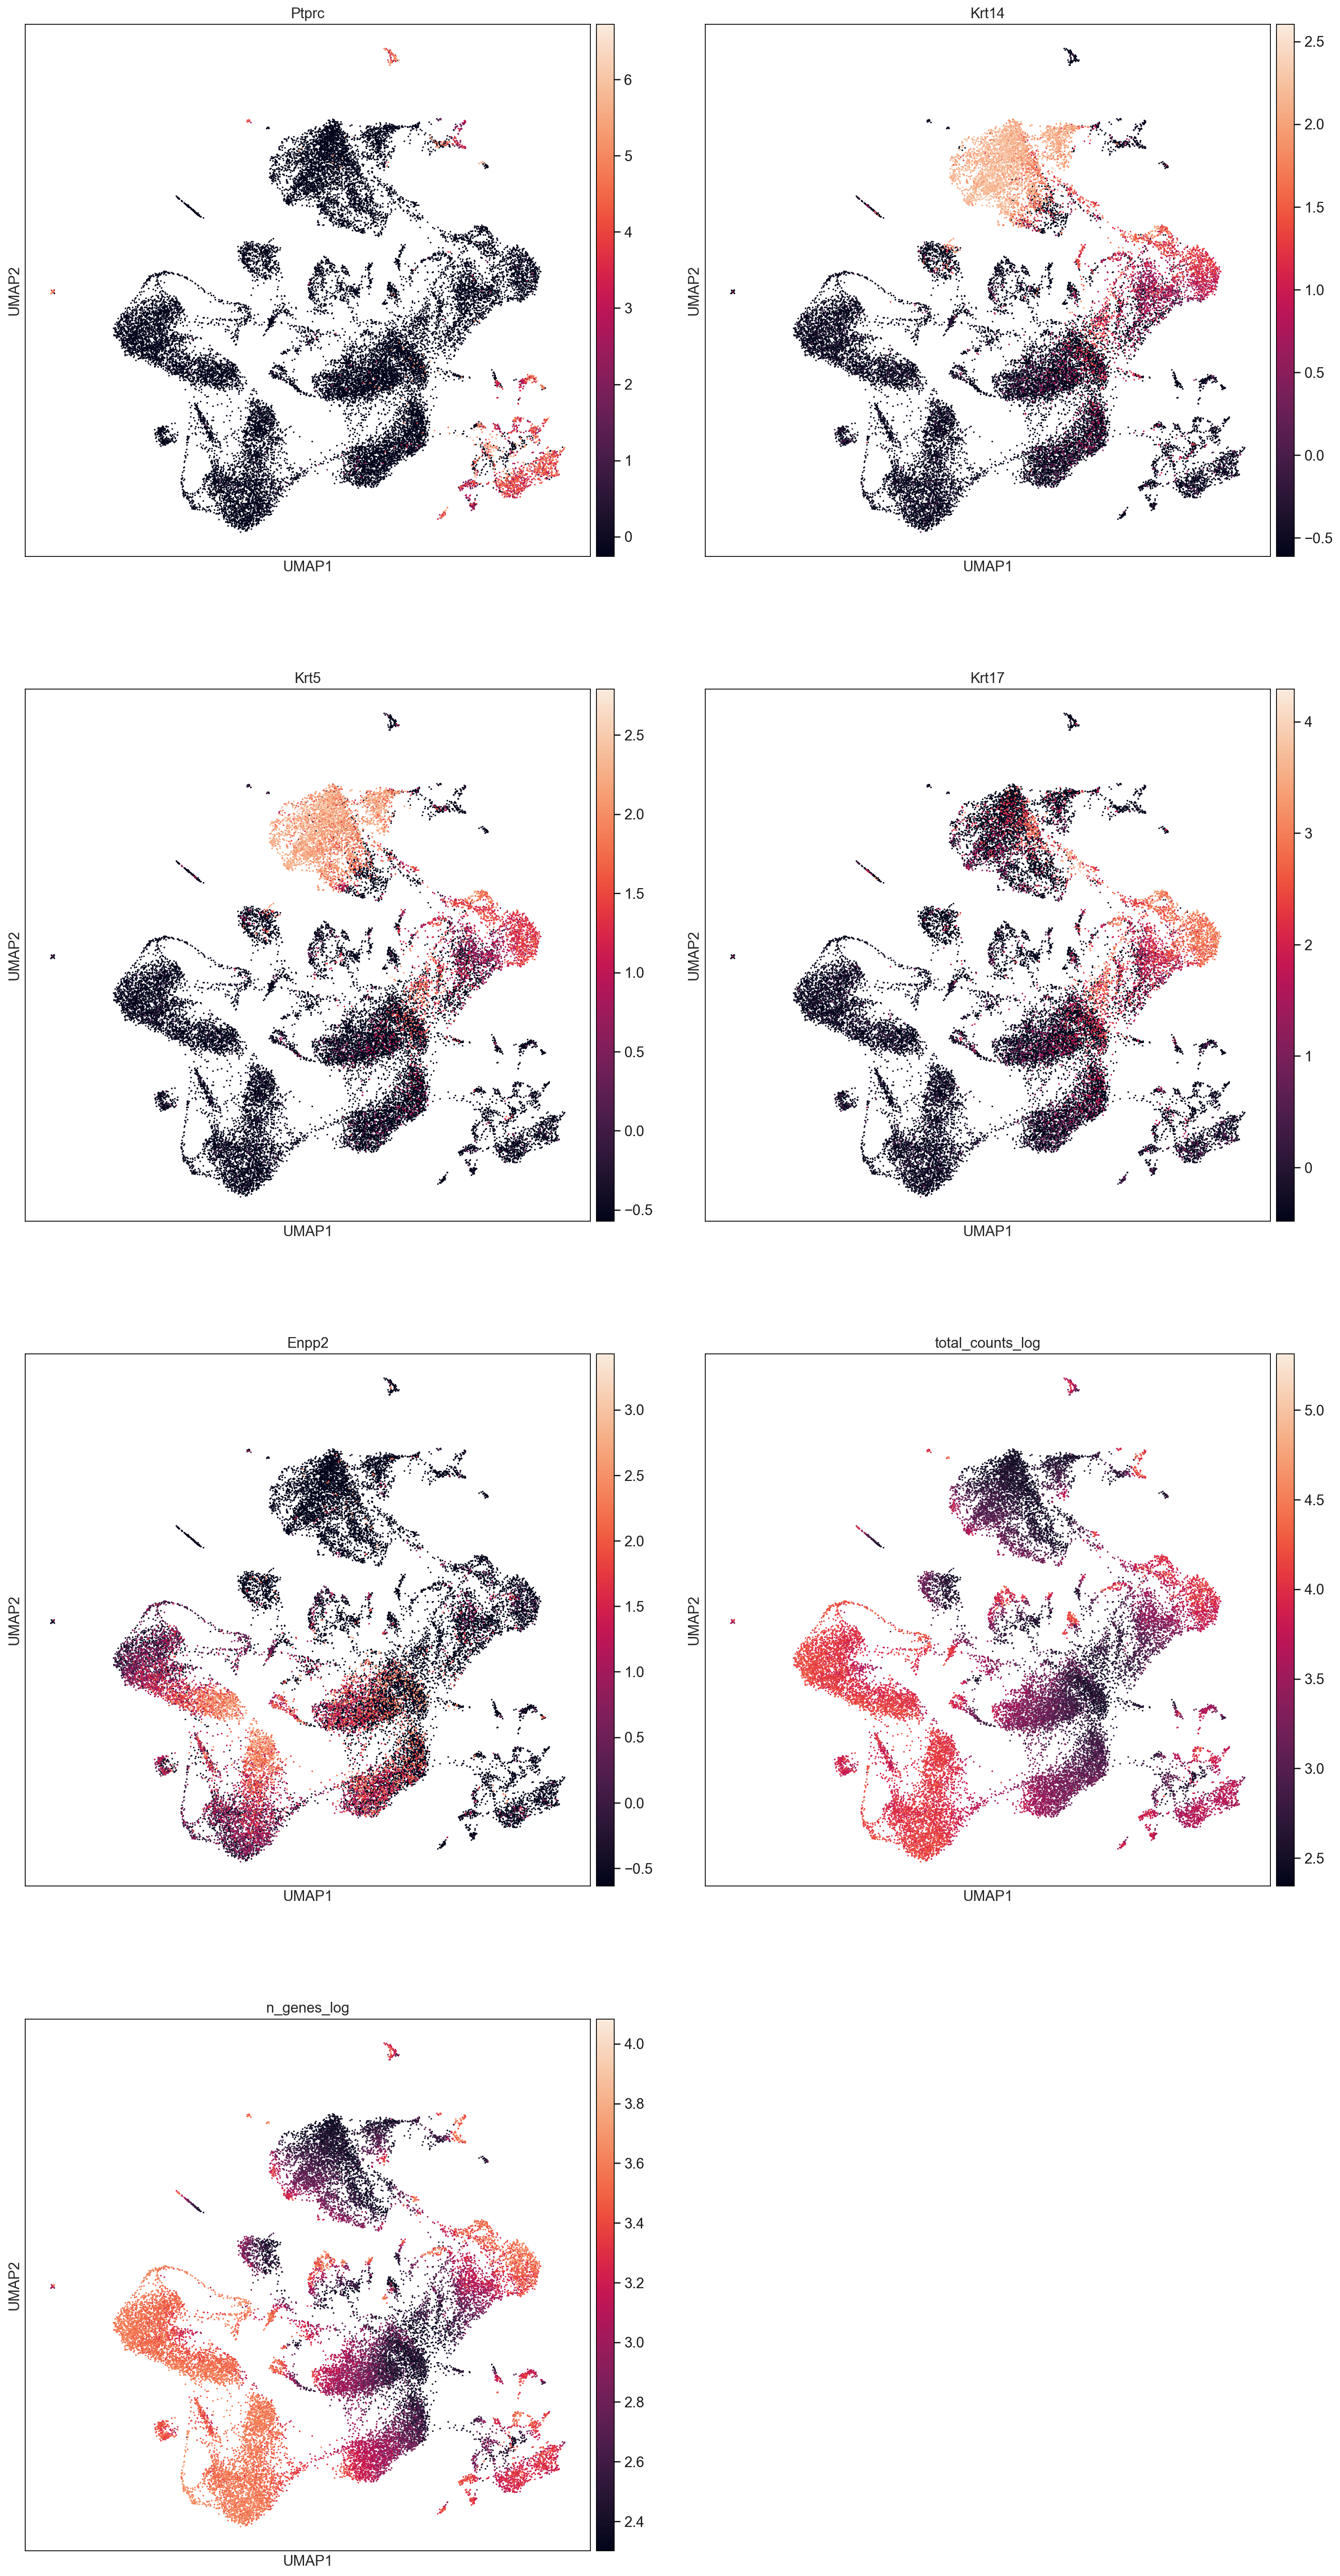
AllCells.obs['total_counts_log'] = np.log10(AllCells.obs['total_counts'])
AllCells.obs['n_genes_log'] = np.log10(AllCells.obs['n_genes'])
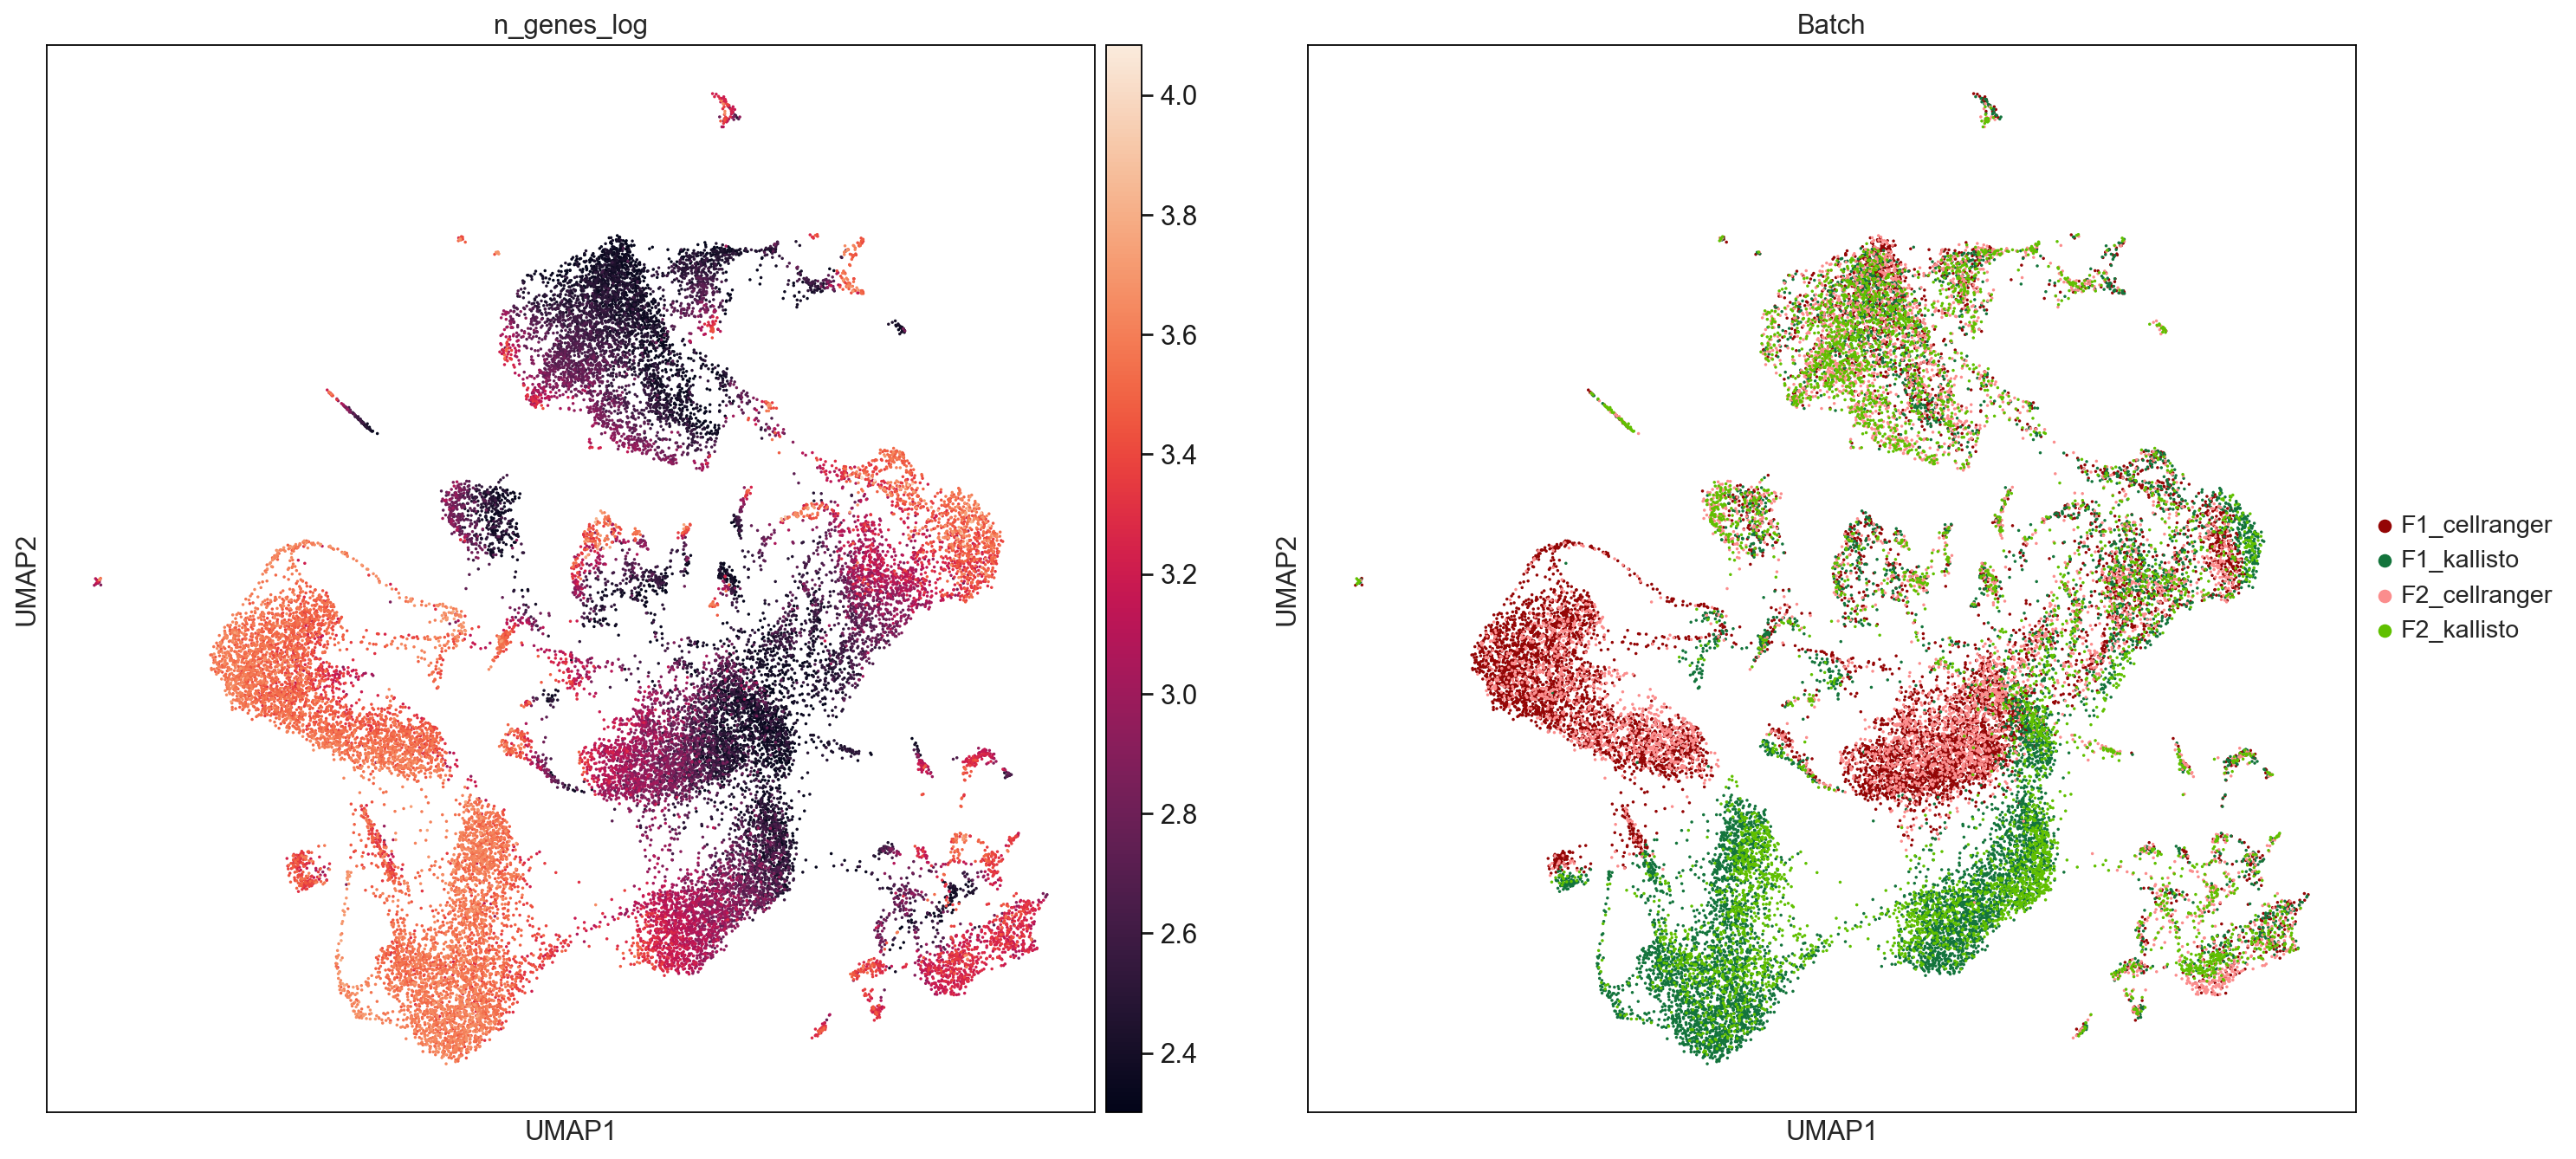
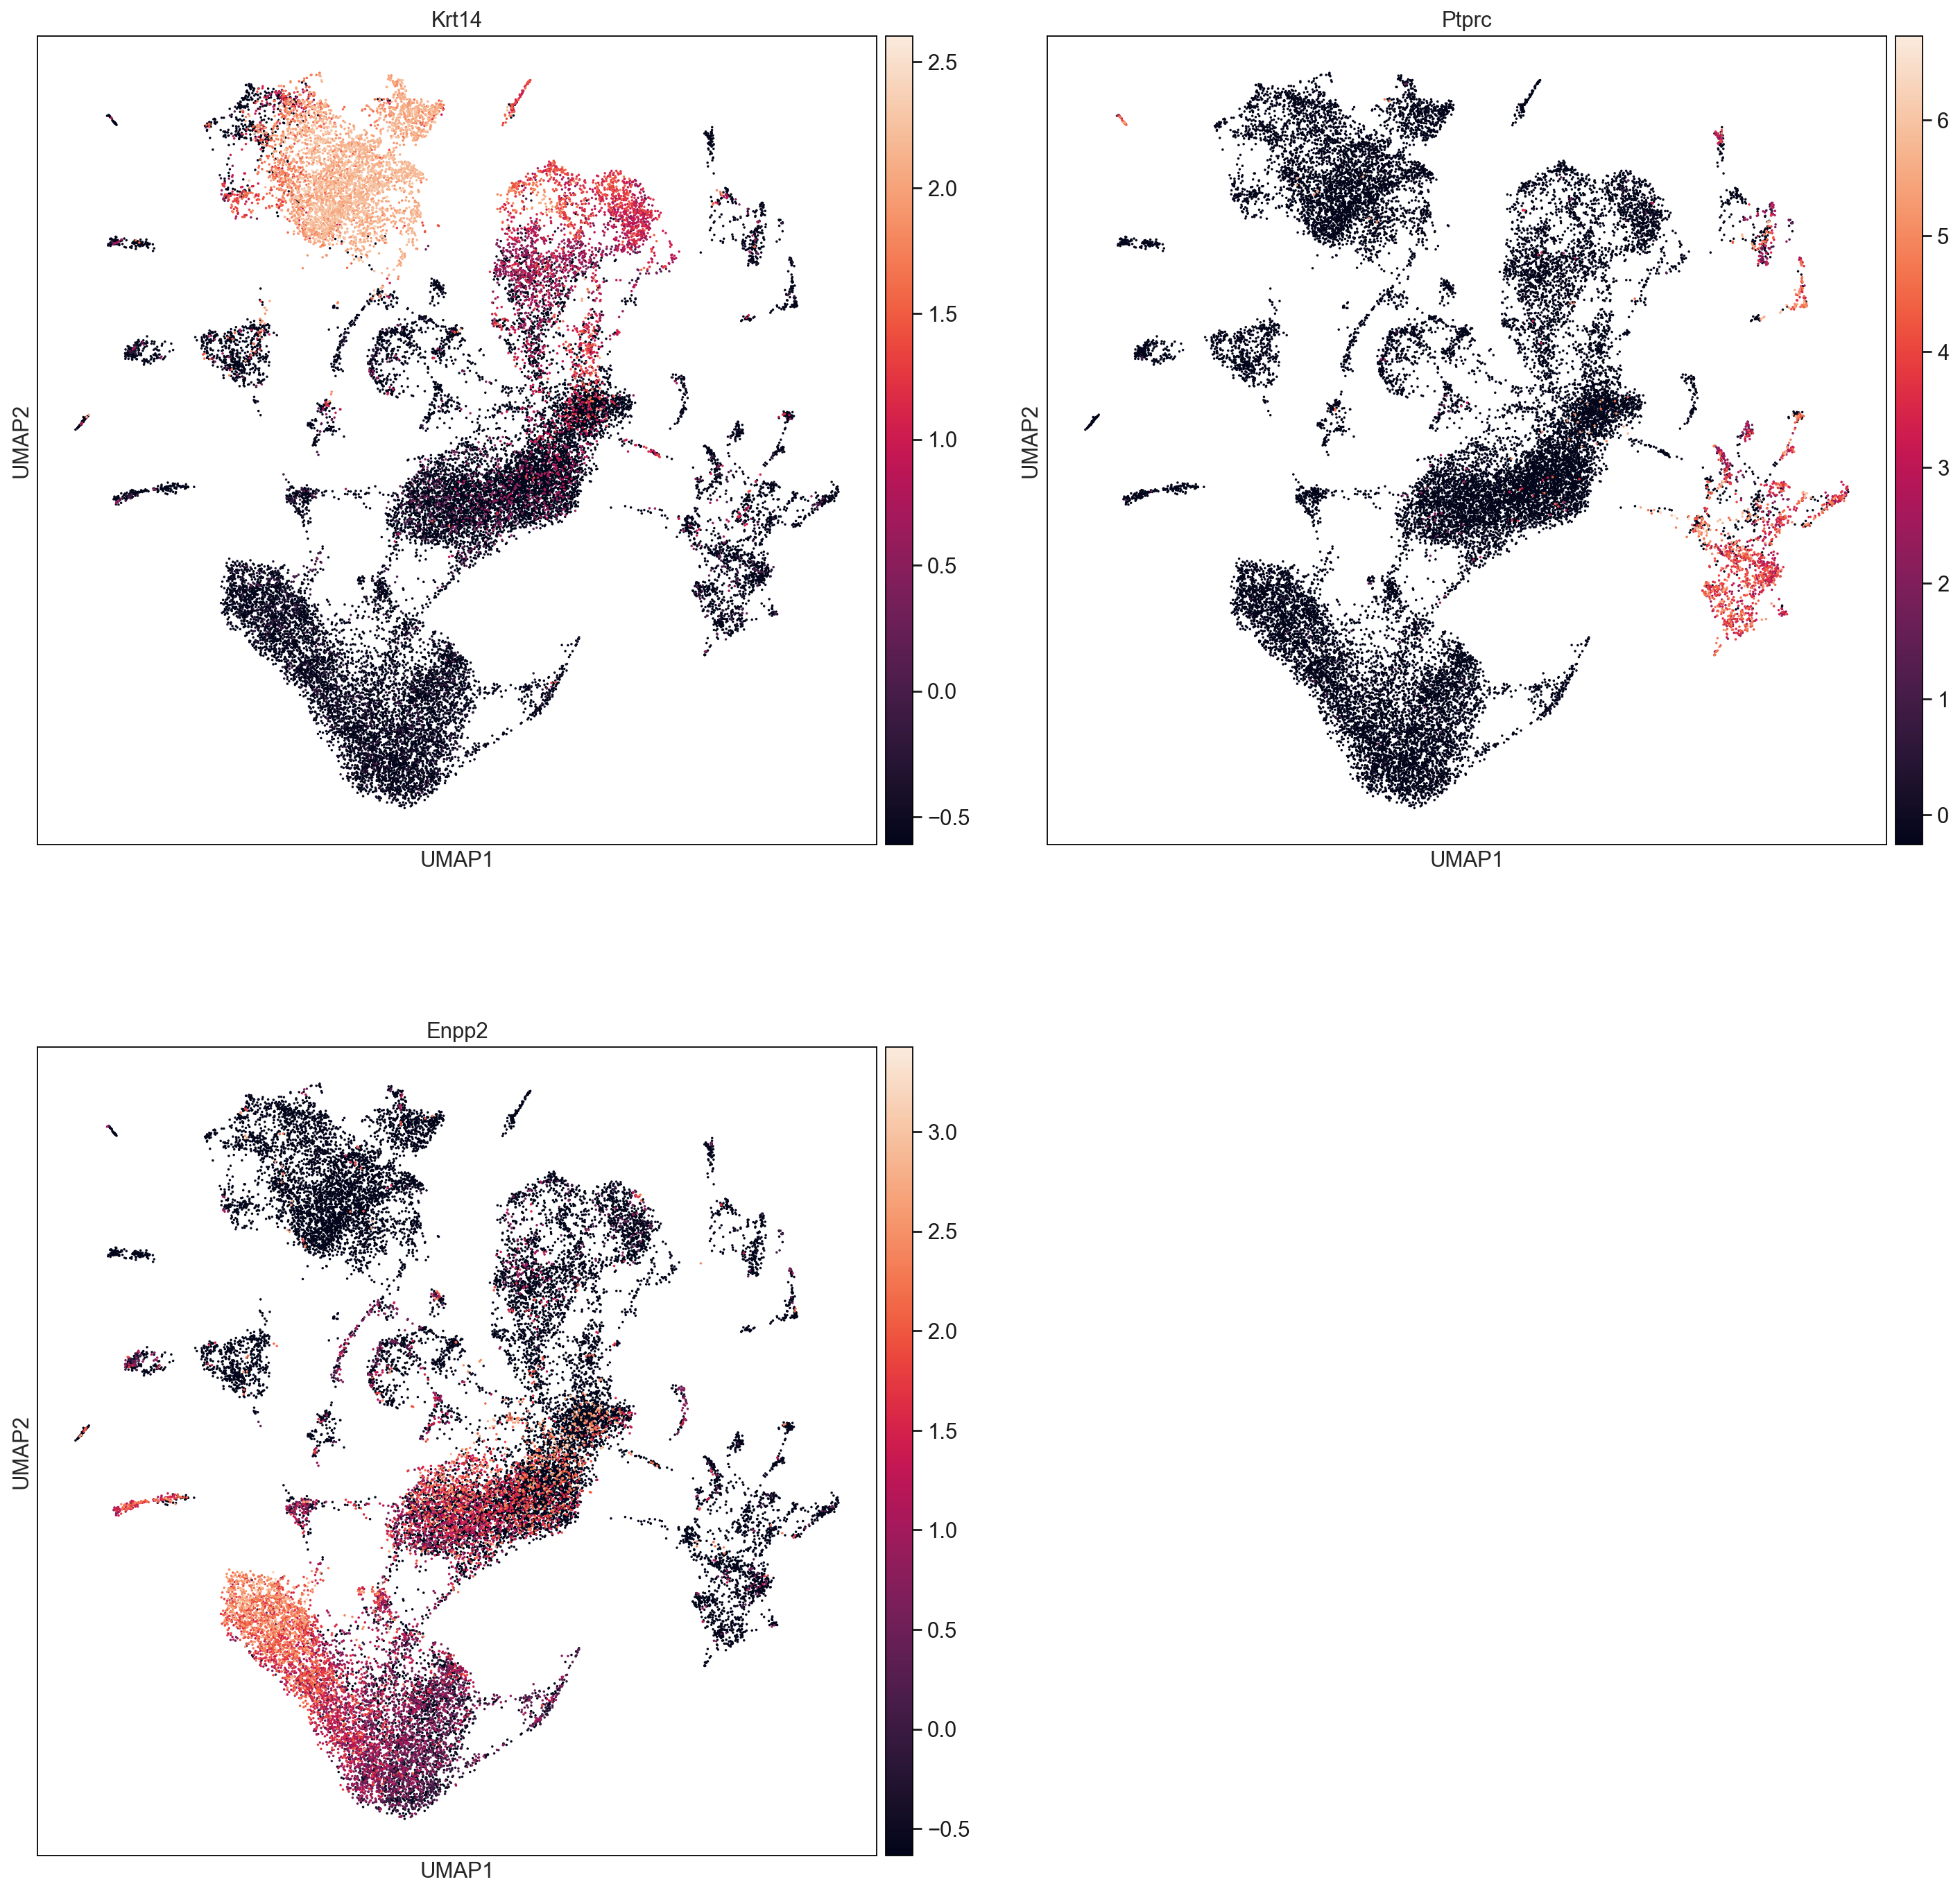
sc.pl.umap(AllCells, color=['Ptprc', 'Krt14', 'Krt5', 'Krt17', 'Enpp2', 'total_counts_log', 'n_genes_log'], size = 10, use_raw=False, ncols =2)
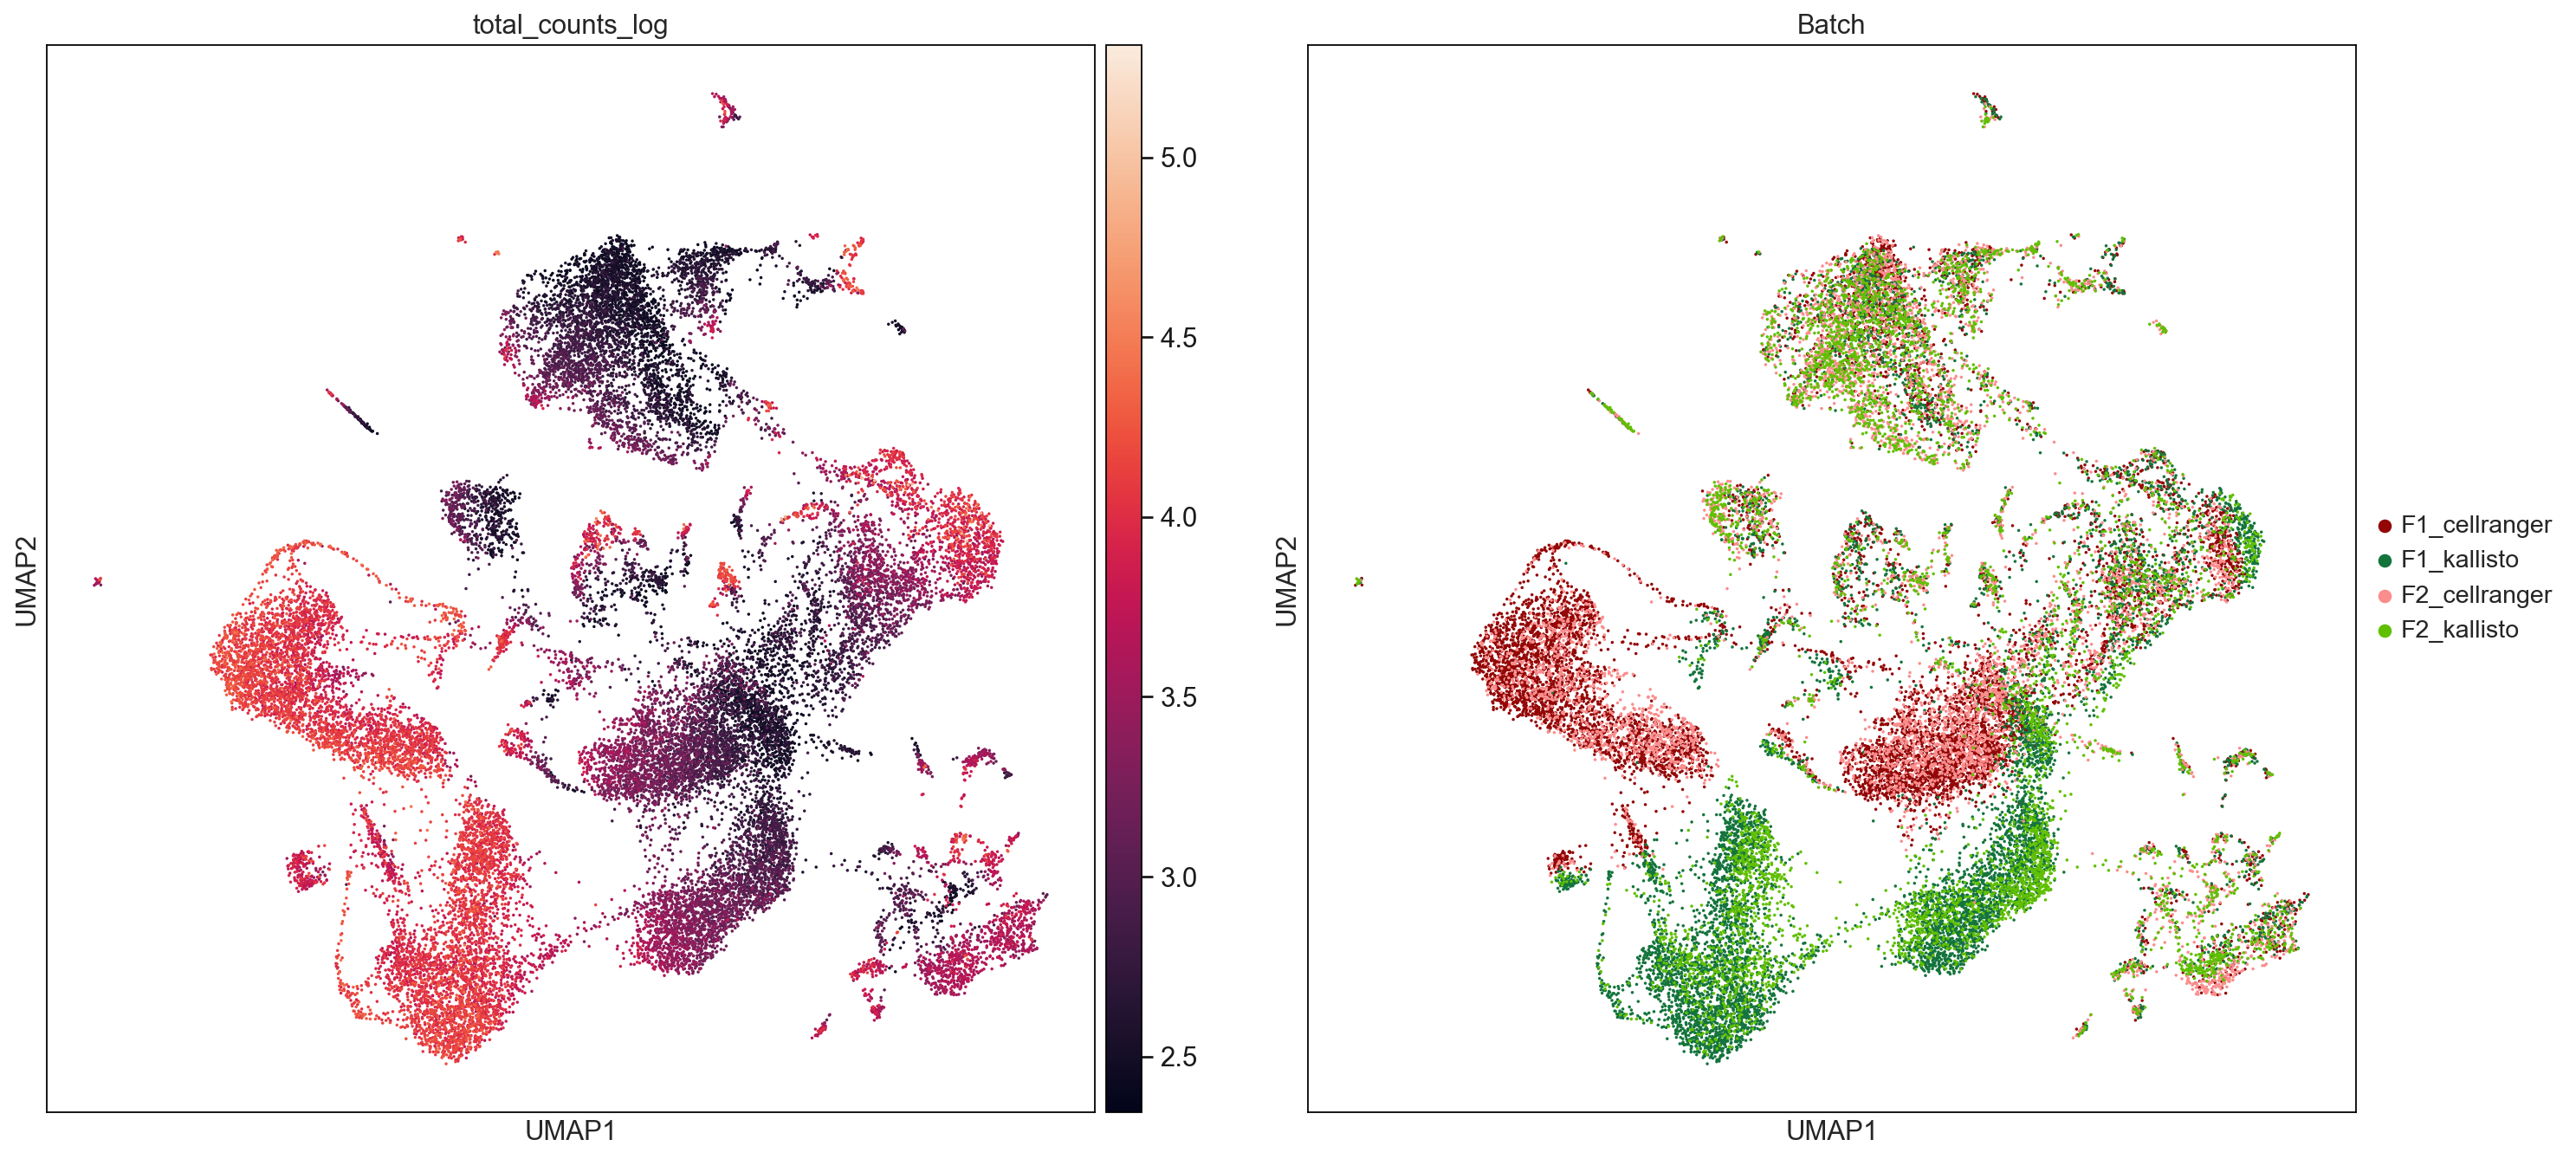
sc.pl.umap(AllCells, color=['total_counts_log', 'Batch'], size = 10, use_raw=False, ncols =2, save='TotalCountsAndNGenes.pdf')
WARNING: saving figure to file figures/umapTotalCountsAndNGenes.pdf
sc.pl.umap(AllCells, color=['n_genes_log', 'Batch'], size = 10, use_raw=False, ncols =2, save='NGenes.pdf')
WARNING: saving figure to file figures/umapNGenes.pdf
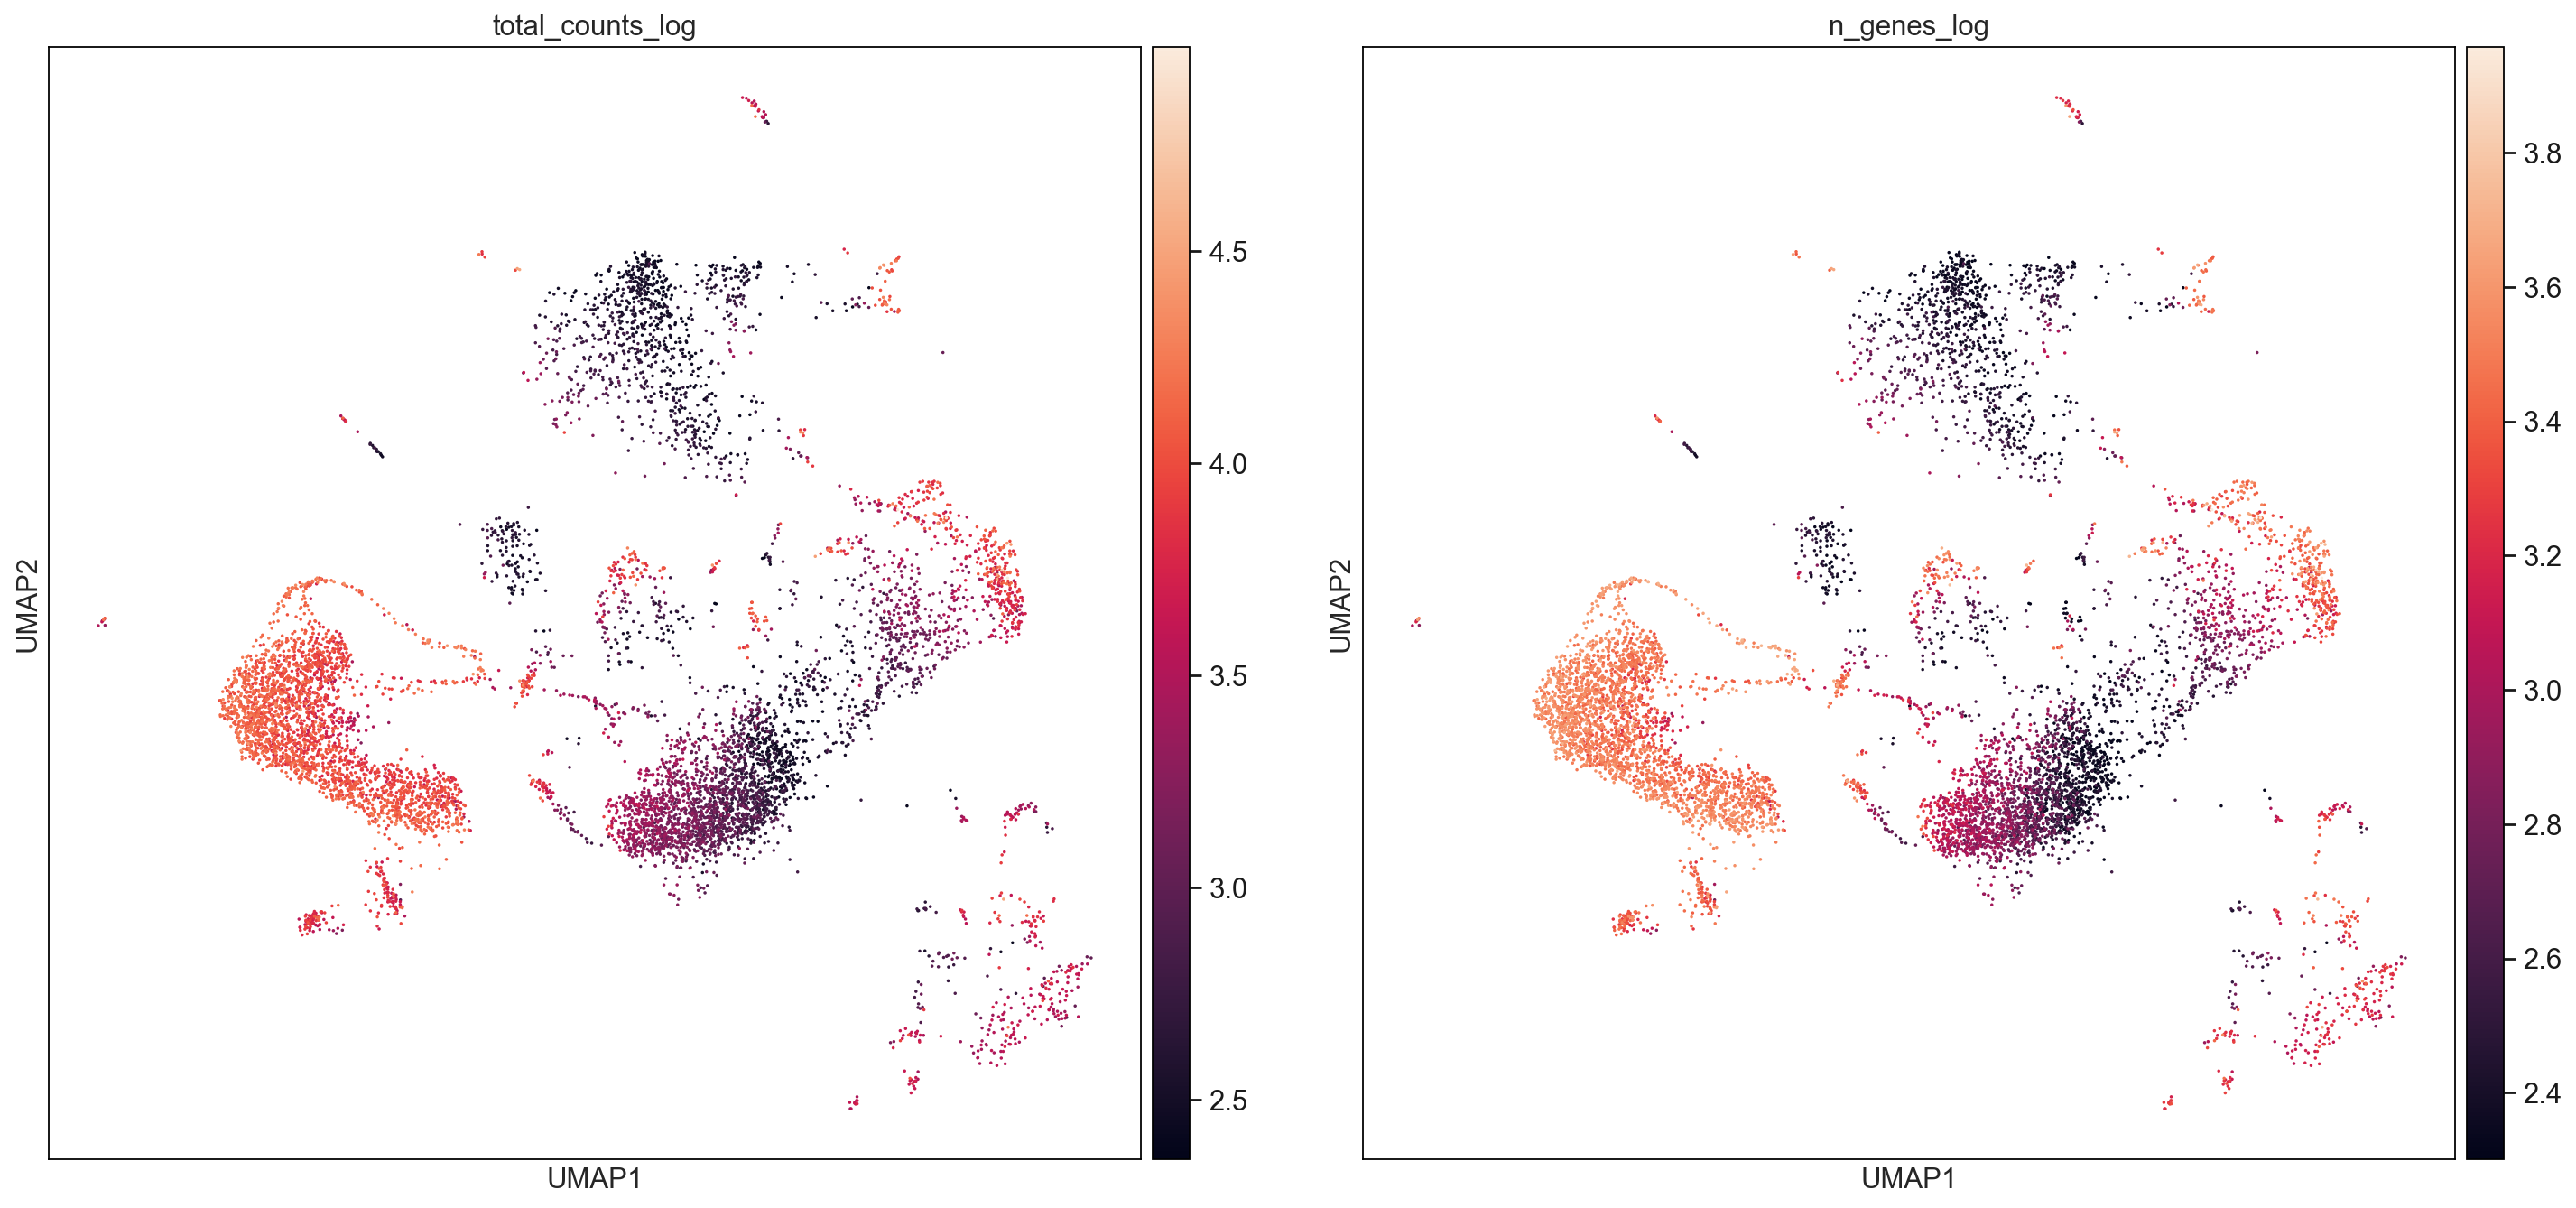
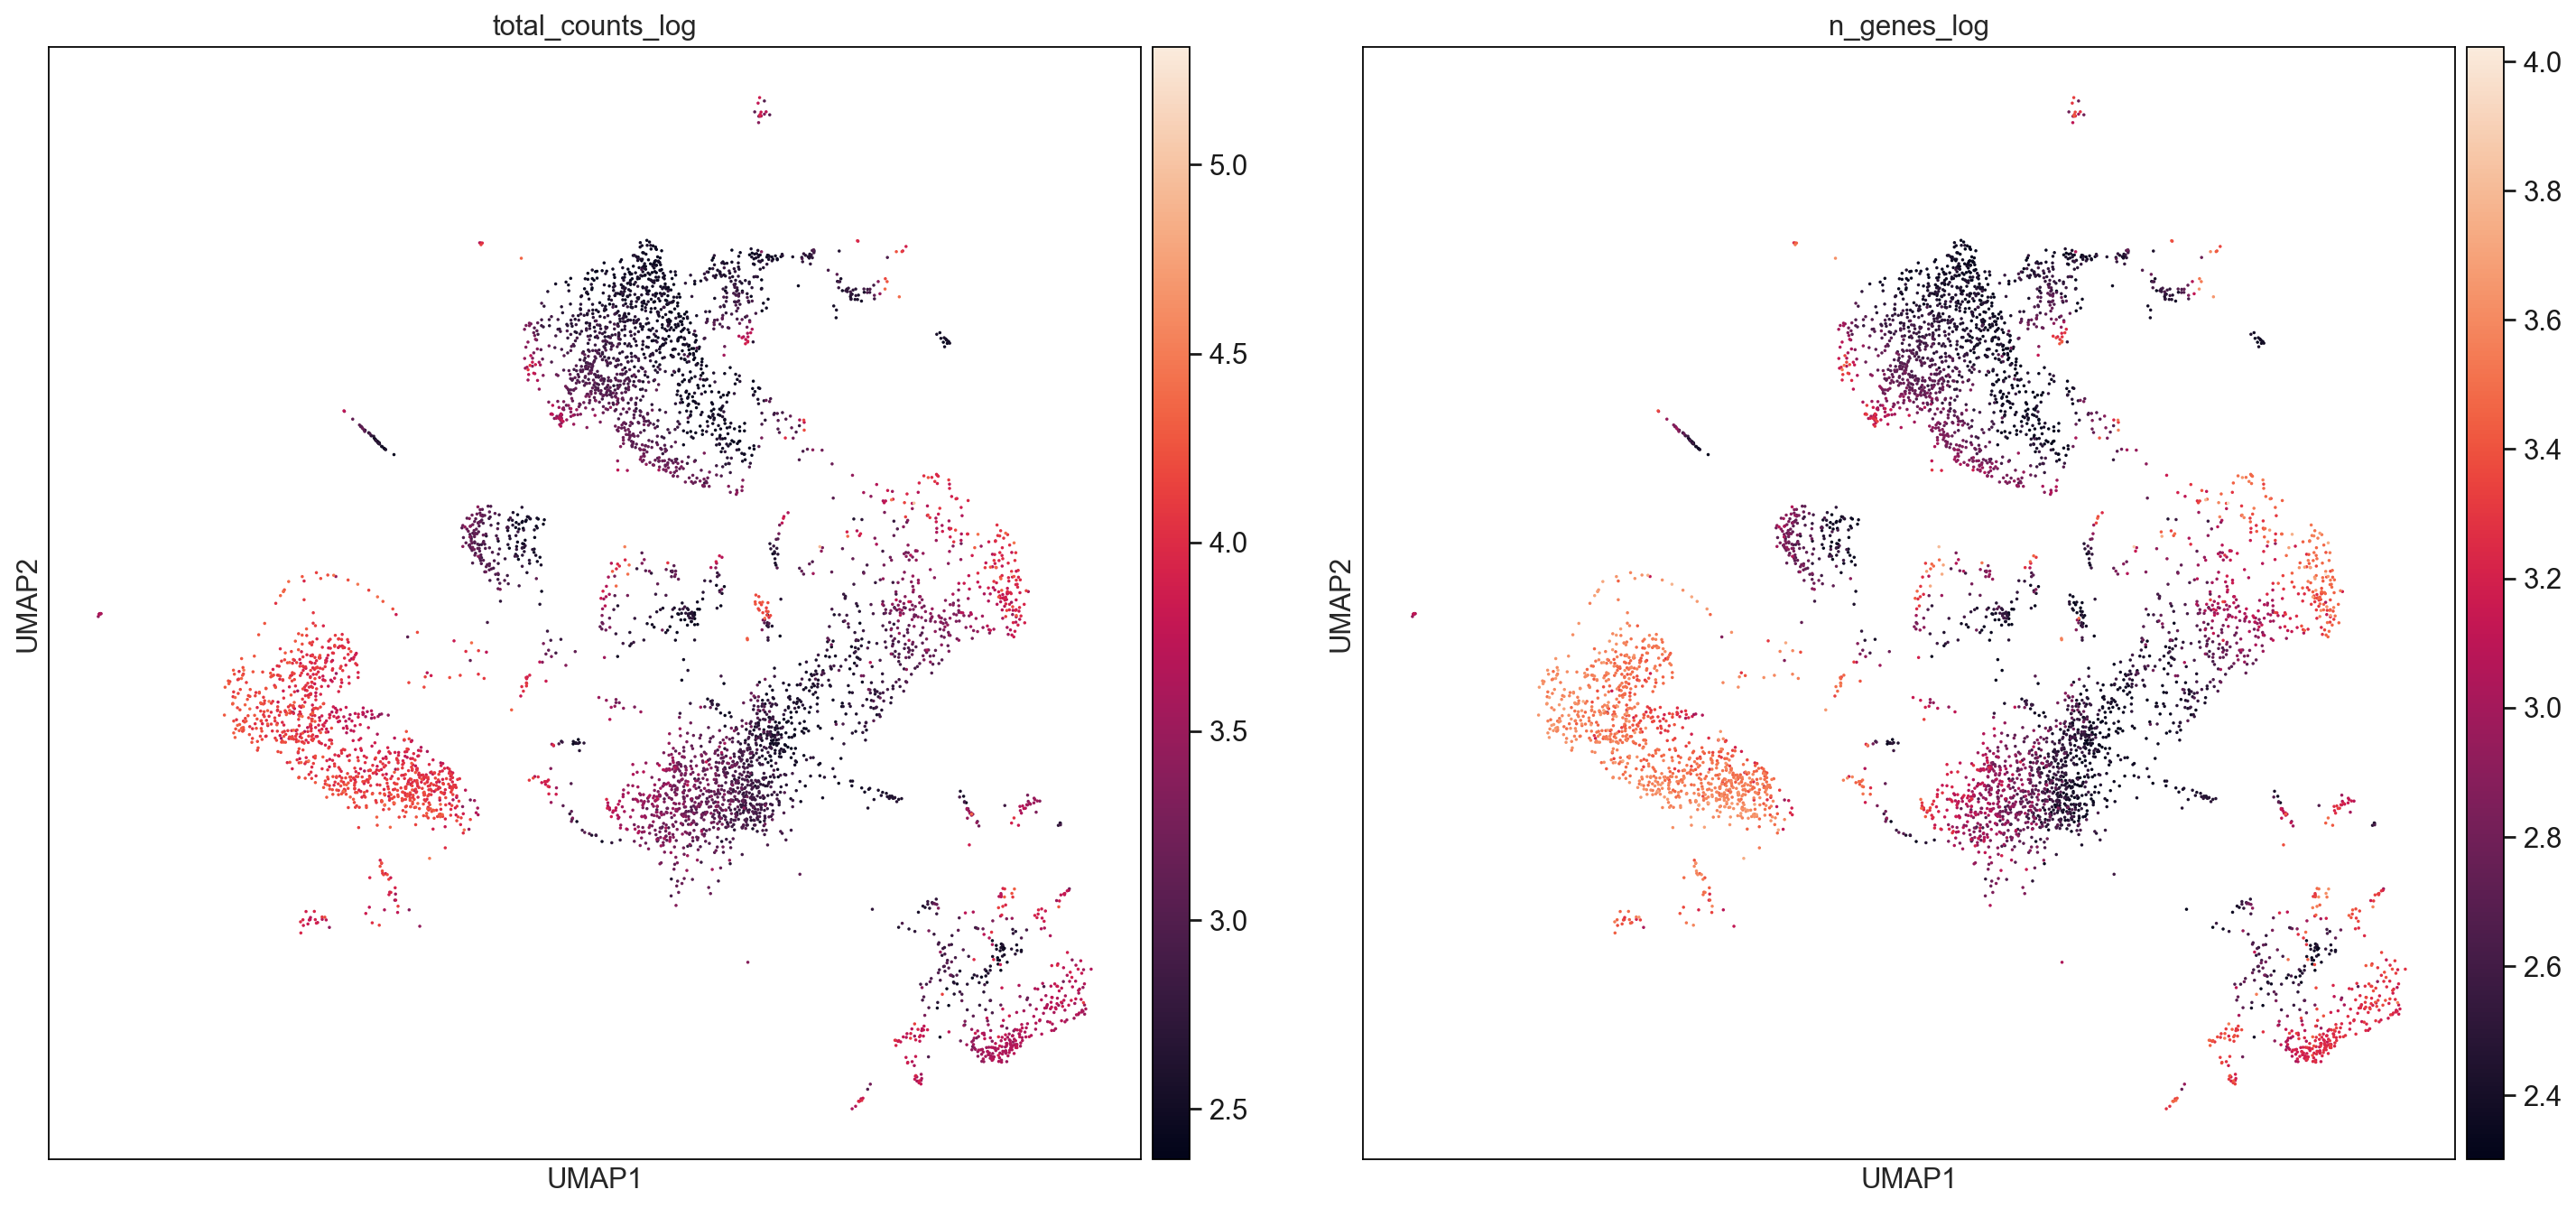
F1_cellranger = AllCells[AllCells.obs["Batch"] == "F1_cellranger",:]
F2_cellranger = AllCells[AllCells.obs["Batch"] == "F2_cellranger",:]
sc.pl.umap(F1_cellranger, color=['total_counts_log', 'n_genes_log'], size = 10, use_raw=False, ncols =2)
sc.pl.umap(F2_cellranger, color=['total_counts_log', 'n_genes_log'], size = 10, use_raw=False, ncols =2)
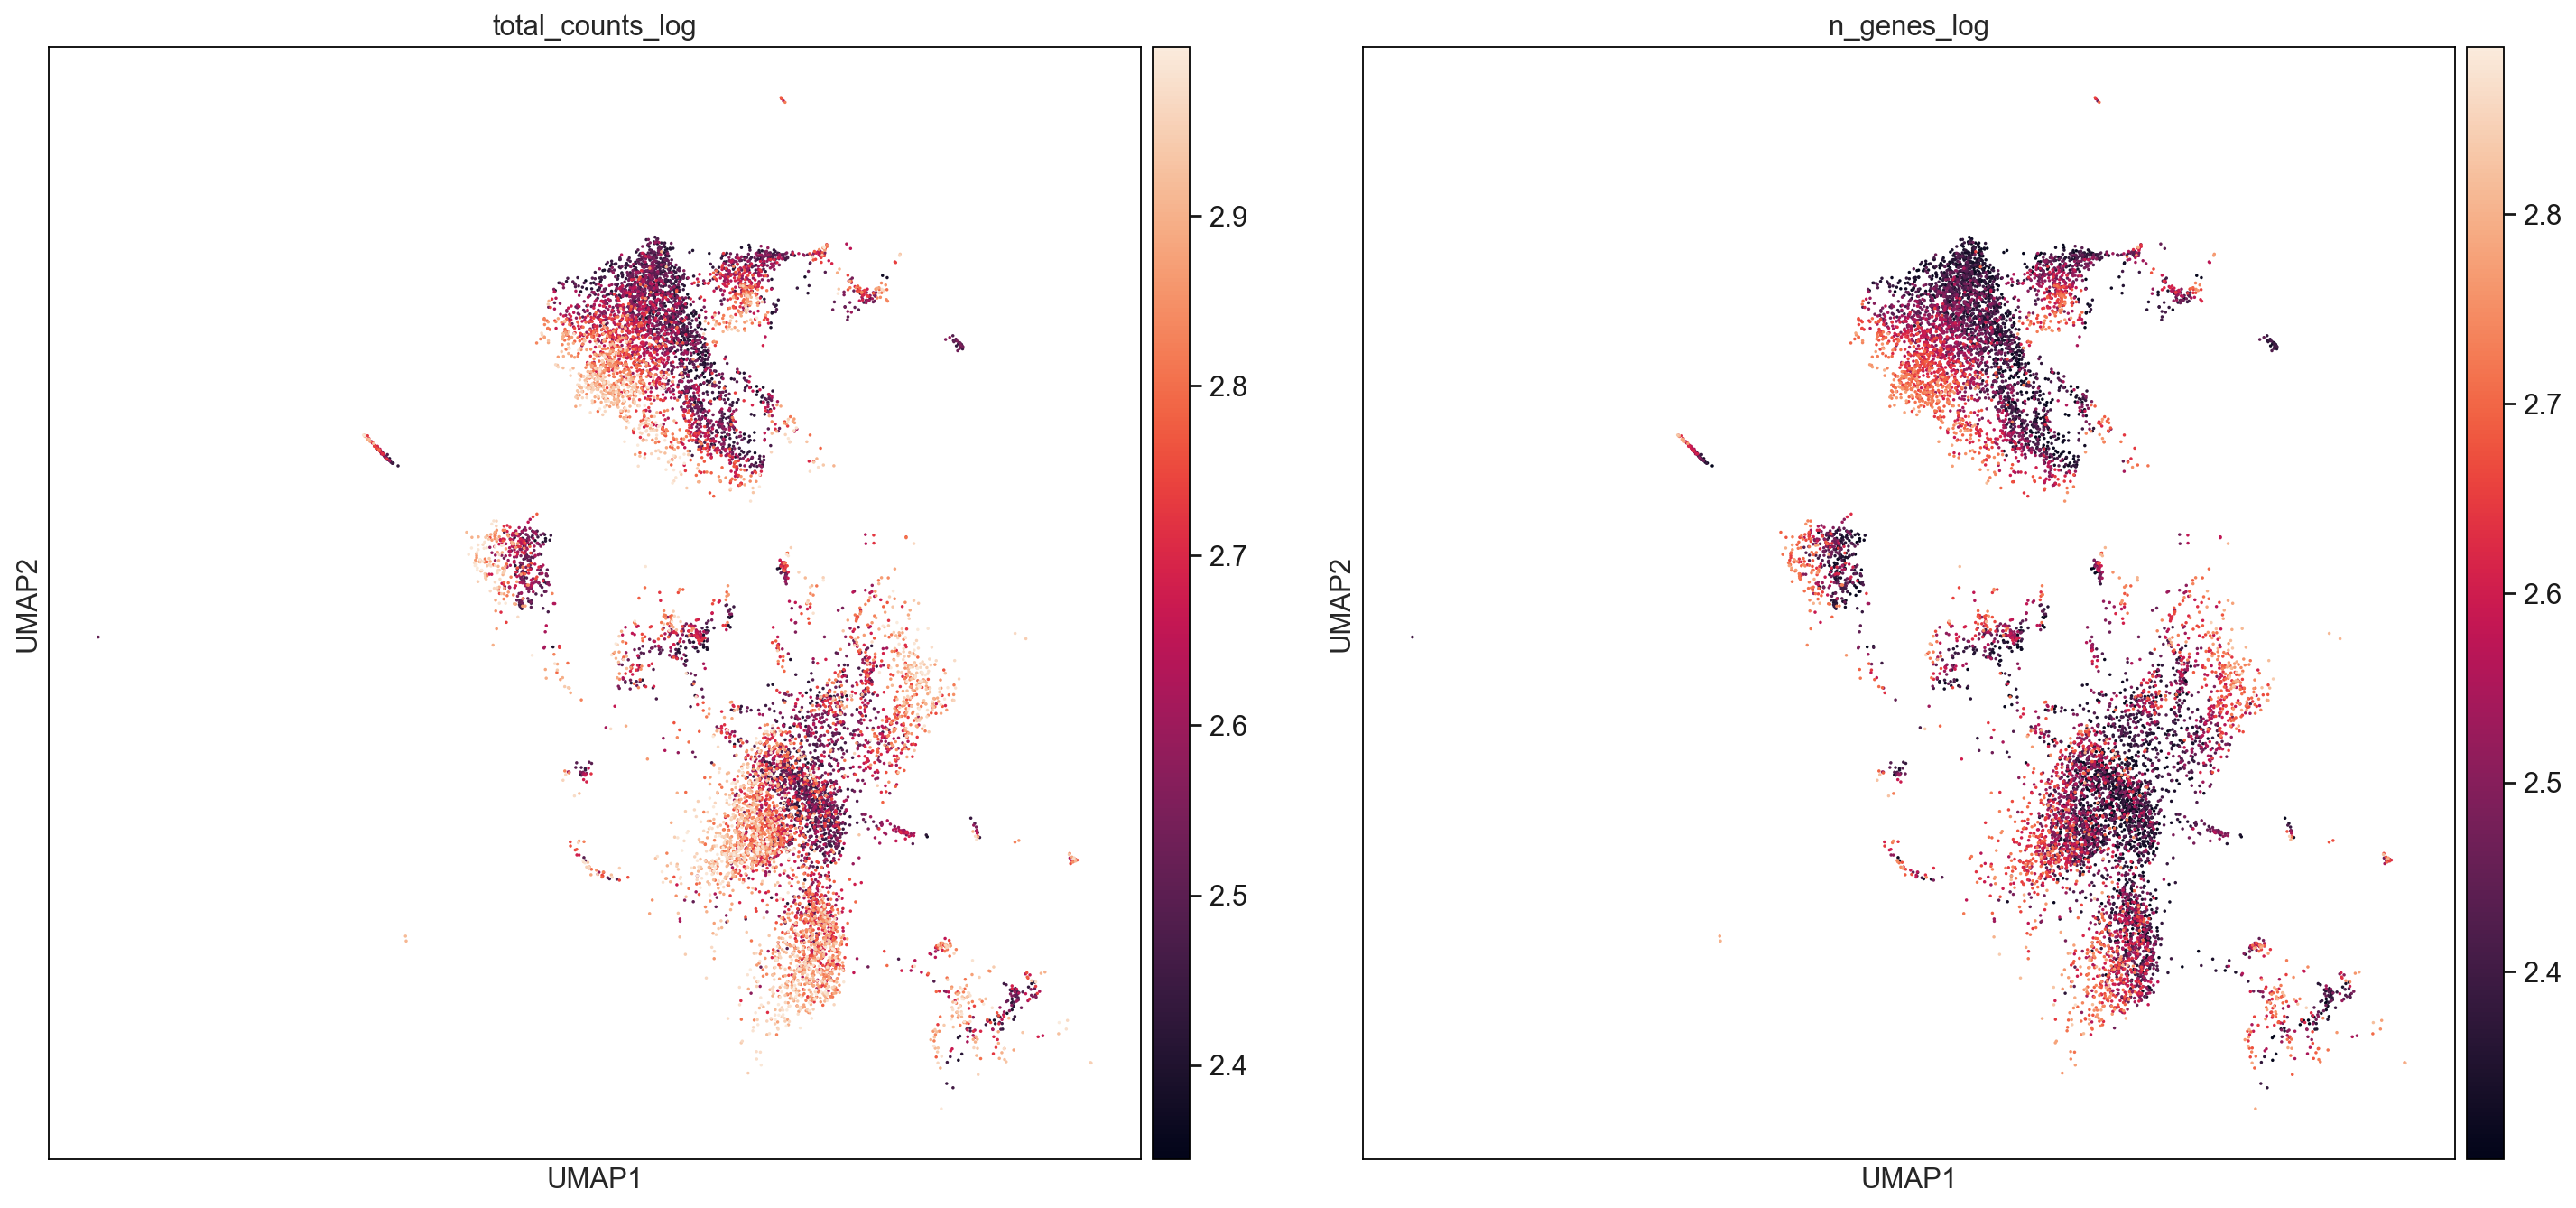
AllCells_totalcountsSubset = AllCells[AllCells.obs["total_counts_log"] < 3,:]
sc.pl.umap(AllCells_totalcountsSubset, color=['total_counts_log', 'n_genes_log'], size = 10, use_raw=False, ncols =2)
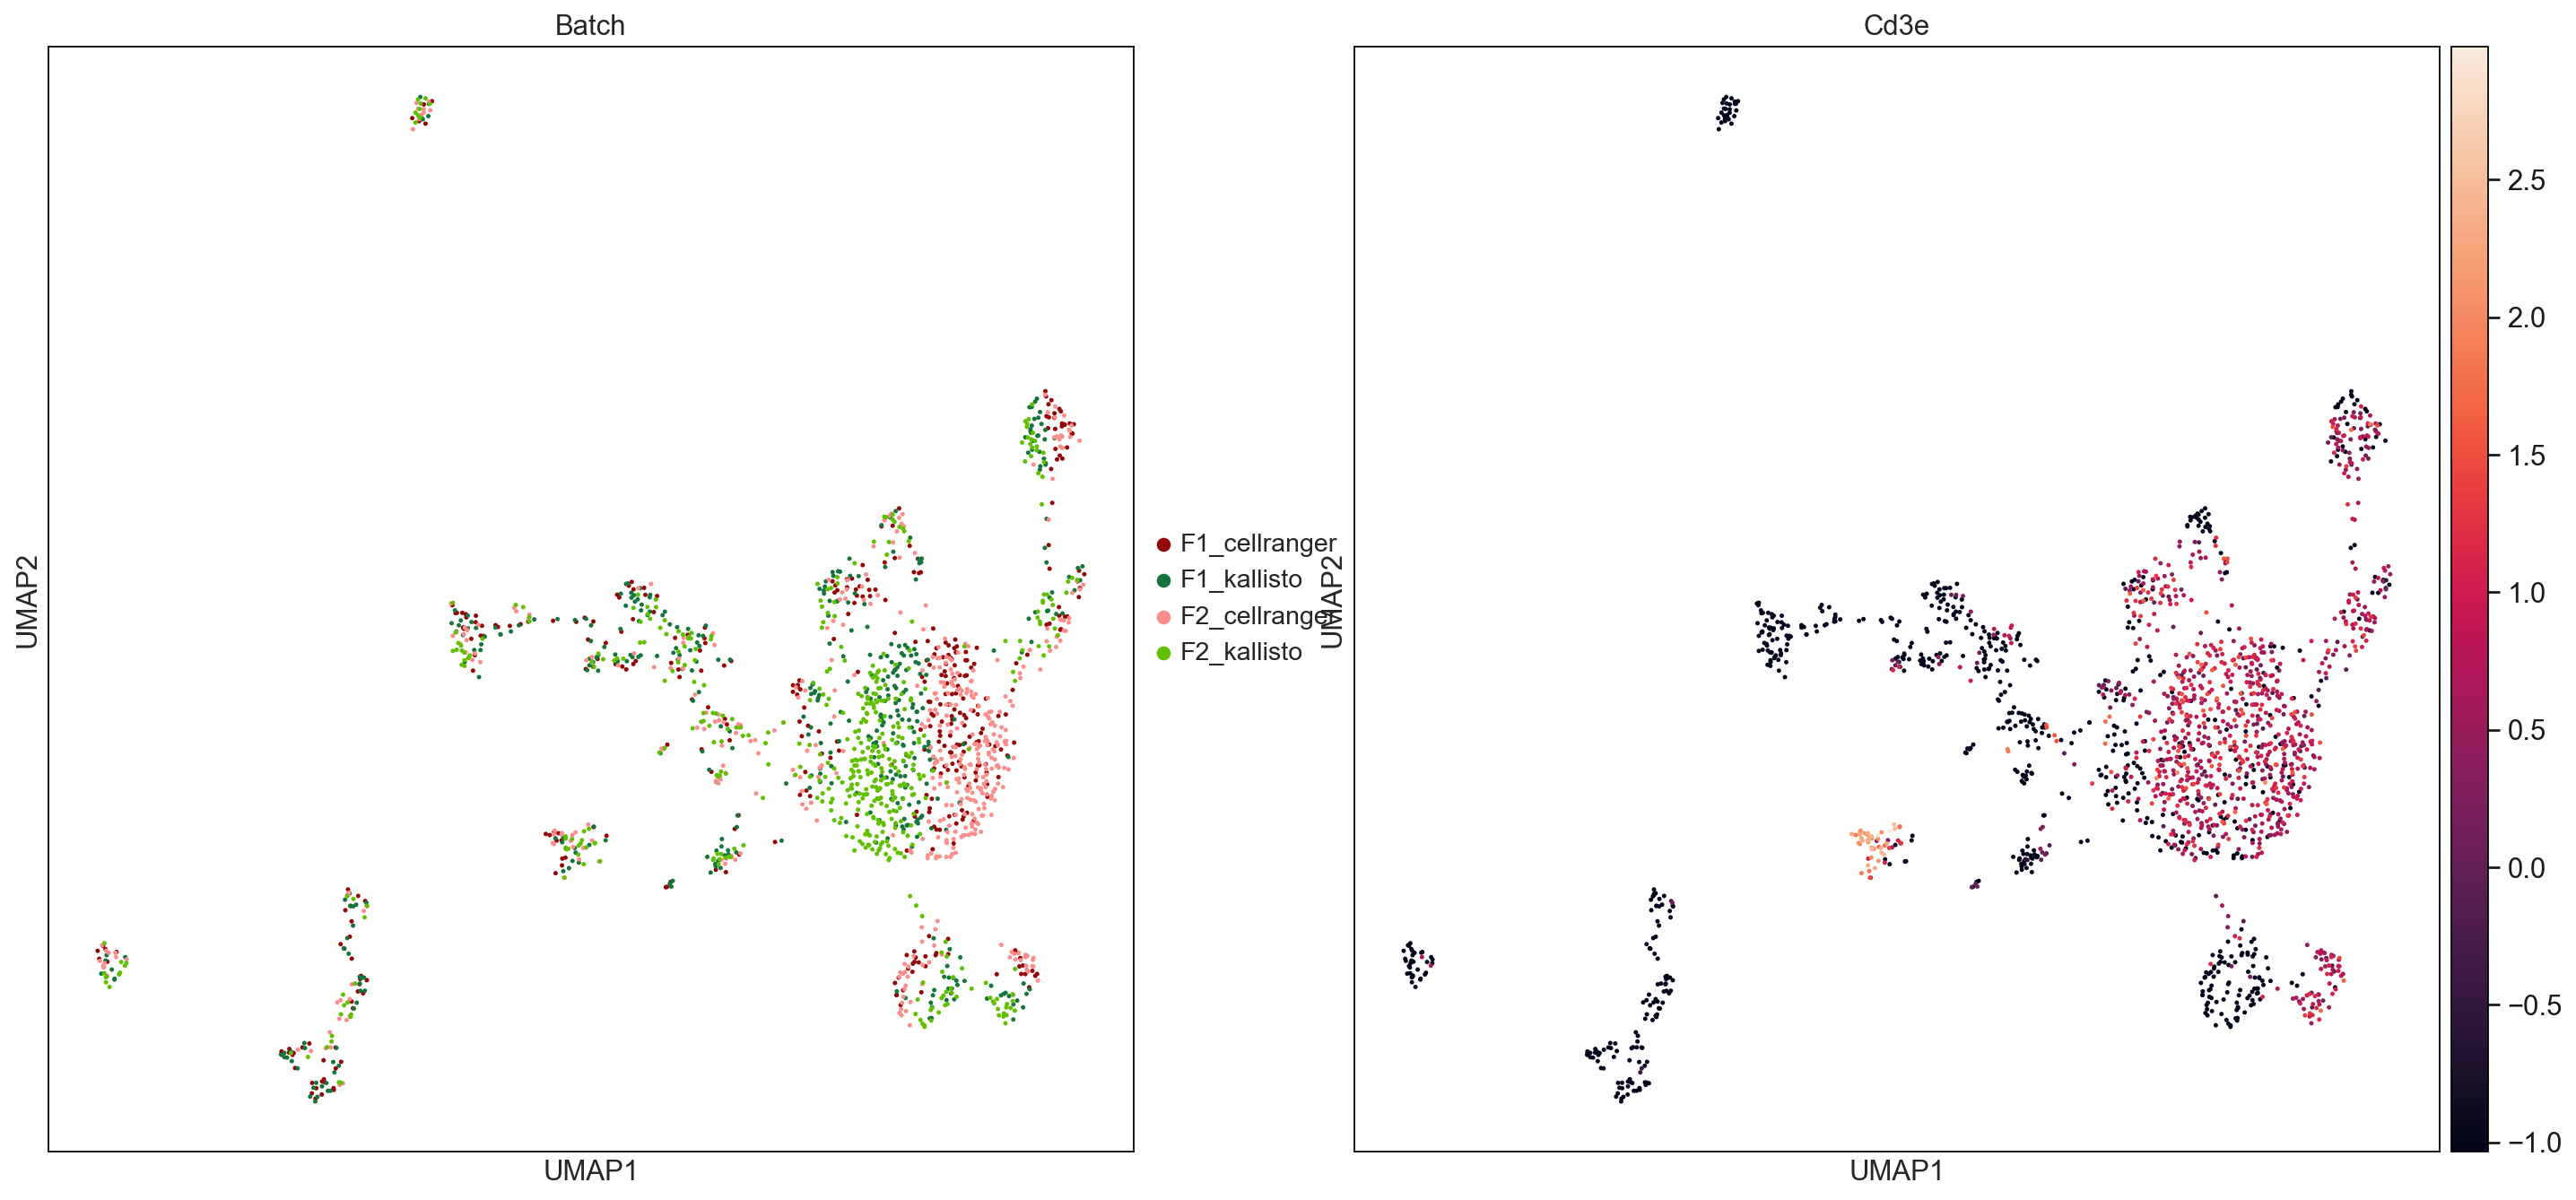
Subset just ICs:
ICs = AllCells[AllCells[:,"Ptprc"].X > 0,:]
ICs_raw = ICs.raw.to_adata()
sc.pp.normalize_total(ICs_raw, target_sum=1e4)
sc.pp.log1p(ICs_raw)

sc.pp.highly_variable_genes(ICs_raw, min_mean=0.0125, max_mean=3, min_disp=0.5)
sc.pp.scale(ICs_raw, max_value=10)
WARNING: adata.X seems to be already log-transformed.
sc.tl.pca(ICs_raw, svd_solver='arpack')
sc.pp.neighbors(ICs_raw, n_neighbors=10, n_pcs=40, metric='cosine')
sc.tl.umap(ICs_raw)
sc.settings.set_figure_params(dpi=80, facecolor='white', figsize=(10,10))
sc.pl.umap(ICs_raw, color=['Batch'], palette = ['#940505', '#13743c','#fb8d8d','#60c000'], size = 20, save = 'UMAPbyBatch_ICs.pdf')
WARNING: saving figure to file figures/umapUMAPbyBatch_ICs.pdf
sc.pl.umap(ICs_raw, color=['Batch', 'Cd3e'], palette = ['#940505', '#13743c','#fb8d8d','#60c000'], size = 20, save = 'UMAPbyBatch_ICs.pdf')
WARNING: saving figure to file figures/umapUMAPbyBatch_ICs.pdf
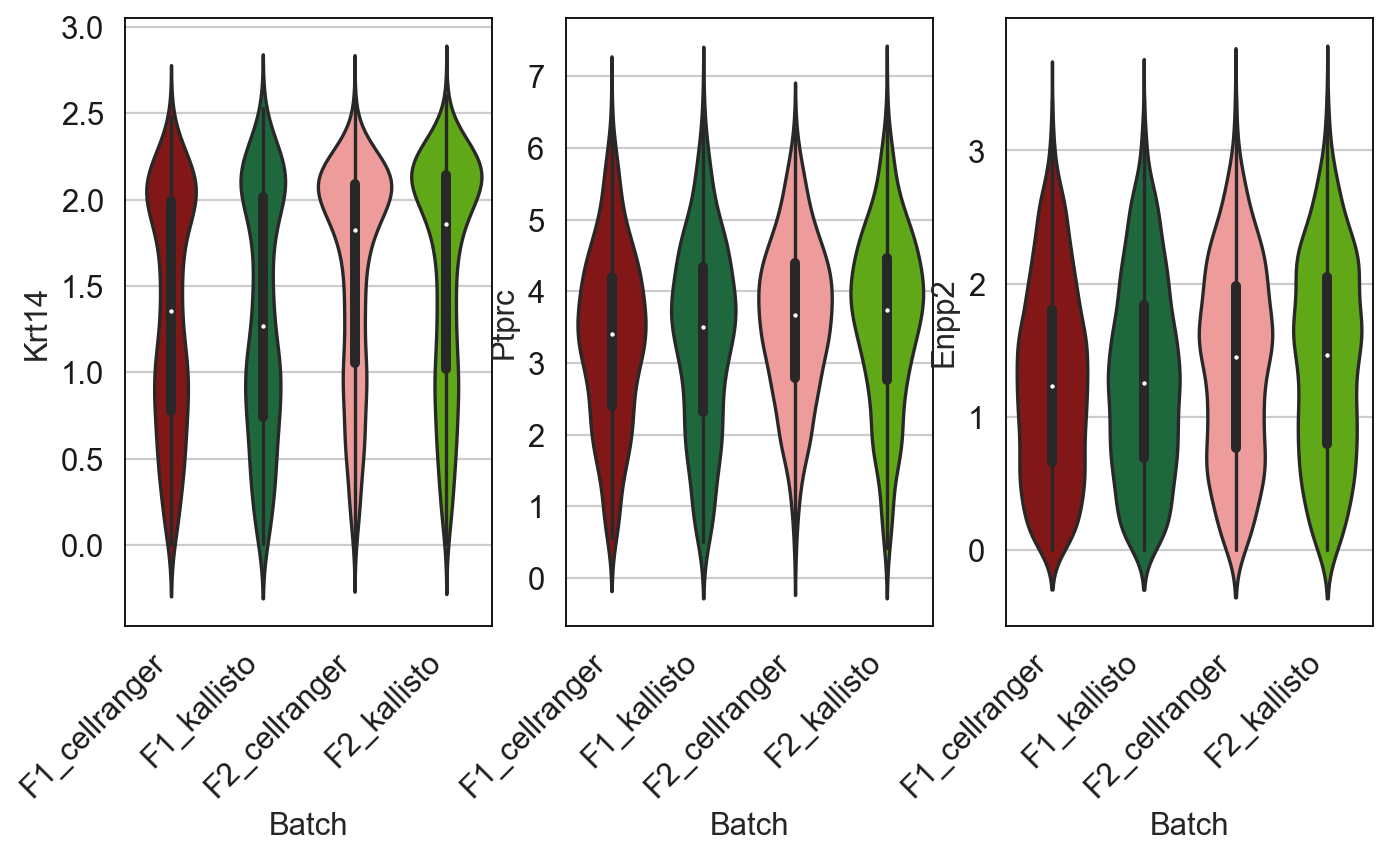
Krts = AllCells[AllCells[:,"Krt14"].X > 0, :]
ICs = AllCells[AllCells[:,"Ptprc"].X > 0, :]
FBs = AllCells[AllCells[:,"Enpp2"].X > 0, :]
Krt14 = np.array(Krts[:,"Krt14"].X).flatten()
Ptprc = np.array(ICs[:,"Ptprc"].X).flatten()
Enpp2 = np.array(FBs[:,"Enpp2"].X).flatten()
Krtsdf = pd.DataFrame()
Krtsdf["Krt14"] = Krt14
Krtsdf["Batch"] = Krts.obs["Batch"].values
ICsdf = pd.DataFrame()
ICsdf["Ptprc"] = Ptprc
ICsdf["Batch"] = ICs.obs["Batch"].values
FBsdf = pd.DataFrame()
FBsdf["Enpp2"] = Enpp2
FBsdf["Batch"] = FBs.obs["Batch"].values
plt.figure(figsize=(10,5))

plt.subplot(1,3,1)

vlnKrts = sns.violinplot(data = Krtsdf, x = 'Batch', y = 'Krt14', palette = ['#940505', '#13743c','#fb8d8d','#60c000'])
vlnKrts.set_xticklabels(labels = np.unique(Krtsdf['Batch']), rotation = 45, ha= 'right')

plt.subplot(1,3,2)

vlnICs = sns.violinplot(data = ICsdf, x = 'Batch', y = 'Ptprc', palette = ['#940505', '#13743c','#fb8d8d','#60c000'])
vlnICs.set_xticklabels(labels = np.unique(ICsdf['Batch']), rotation = 45, ha= 'right')

plt.subplot(1,3,3)

vlnFBs = sns.violinplot(data = FBsdf, x = 'Batch', y = 'Enpp2', palette = ['#940505', '#13743c','#fb8d8d','#60c000'])
vlnFBs.set_xticklabels(labels = np.unique(FBsdf['Batch']), rotation = 45, ha= 'right')

plt.savefig('/Users/emmanueldollinger/Desktop/DiffGenes.pdf', dpi=300, transparent = False)
Let’s see if I can batch correct out the aligners. Using harmony:
import scanpy.external as sce
AllCells
AnnData object with n_obs × n_vars = 26926 × 19093
    obs: 'n_genes', 'n_genes_by_counts', 'total_counts', 'Mouse', 'Aligner', 'Batch', 'batch', 'total_counts_mt', 'pct_counts_mt', 'total_counts_log', 'n_genes_log'
    var: 'gene_ids-0', 'feature_types-0', 'genome-0', 'n_cells-0', 'n_cells_by_counts-0', 'mean_counts-0', 'pct_dropout_by_counts-0', 'total_counts-0', 'n_cells-1', 'n_cells_by_counts-1', 'mean_counts-1', 'pct_dropout_by_counts-1', 'total_counts-1', 'gene_ids-2', 'feature_types-2', 'genome-2', 'n_cells-2', 'n_cells_by_counts-2', 'mean_counts-2', 'pct_dropout_by_counts-2', 'total_counts-2', 'n_cells-3', 'n_cells_by_counts-3', 'mean_counts-3', 'pct_dropout_by_counts-3', 'total_counts-3', 'mt', 'n_cells_by_counts', 'mean_counts', 'pct_dropout_by_counts', 'total_counts', 'highly_variable', 'means', 'dispersions', 'dispersions_norm', 'mean', 'std'
    uns: 'log1p', 'hvg', 'pca', 'neighbors', 'umap', 'Batch_colors'
    obsm: 'X_pca', 'X_umap'
    varm: 'PCs'
    obsp: 'distances', 'connectivities'
sce.pp.harmony_integrate(AllCells, key='Batch')
2021-04-04 14:42:52,989 - harmonypy - INFO - Iteration 1 of 10
2021-04-04 14:42:59,047 - harmonypy - INFO - Iteration 2 of 10
2021-04-04 14:43:05,159 - harmonypy - INFO - Iteration 3 of 10
2021-04-04 14:43:11,282 - harmonypy - INFO - Iteration 4 of 10
2021-04-04 14:43:13,433 - harmonypy - INFO - Iteration 5 of 10
2021-04-04 14:43:17,269 - harmonypy - INFO - Iteration 6 of 10
2021-04-04 14:43:19,164 - harmonypy - INFO - Iteration 7 of 10
2021-04-04 14:43:21,061 - harmonypy - INFO - Converged after 7 iterations
AllCells
AnnData object with n_obs × n_vars = 26926 × 19093
    obs: 'n_genes', 'n_genes_by_counts', 'total_counts', 'Mouse', 'Aligner', 'Batch', 'batch', 'total_counts_mt', 'pct_counts_mt', 'total_counts_log', 'n_genes_log'
    var: 'gene_ids-0', 'feature_types-0', 'genome-0', 'n_cells-0', 'n_cells_by_counts-0', 'mean_counts-0', 'pct_dropout_by_counts-0', 'total_counts-0', 'n_cells-1', 'n_cells_by_counts-1', 'mean_counts-1', 'pct_dropout_by_counts-1', 'total_counts-1', 'gene_ids-2', 'feature_types-2', 'genome-2', 'n_cells-2', 'n_cells_by_counts-2', 'mean_counts-2', 'pct_dropout_by_counts-2', 'total_counts-2', 'n_cells-3', 'n_cells_by_counts-3', 'mean_counts-3', 'pct_dropout_by_counts-3', 'total_counts-3', 'mt', 'n_cells_by_counts', 'mean_counts', 'pct_dropout_by_counts', 'total_counts', 'highly_variable', 'means', 'dispersions', 'dispersions_norm', 'mean', 'std'
    uns: 'log1p', 'hvg', 'pca', 'neighbors', 'umap', 'Batch_colors'
    obsm: 'X_pca', 'X_umap', 'X_pca_harmony'
    varm: 'PCs'
    obsp: 'distances', 'connectivities'
sc.pp.neighbors(AllCells, n_neighbors=10, n_pcs=40, metric='cosine', use_rep='X_pca_harmony', key_added='neighbors_Harmony')
AllCells.obsm['X_umap_Original'] = AllCells.obsm['X_umap'].copy()
AllCells
AnnData object with n_obs × n_vars = 26926 × 19093
    obs: 'n_genes', 'n_genes_by_counts', 'total_counts', 'Mouse', 'Aligner', 'Batch', 'batch', 'total_counts_mt', 'pct_counts_mt', 'total_counts_log', 'n_genes_log'
    var: 'gene_ids-0', 'feature_types-0', 'genome-0', 'n_cells-0', 'n_cells_by_counts-0', 'mean_counts-0', 'pct_dropout_by_counts-0', 'total_counts-0', 'n_cells-1', 'n_cells_by_counts-1', 'mean_counts-1', 'pct_dropout_by_counts-1', 'total_counts-1', 'gene_ids-2', 'feature_types-2', 'genome-2', 'n_cells-2', 'n_cells_by_counts-2', 'mean_counts-2', 'pct_dropout_by_counts-2', 'total_counts-2', 'n_cells-3', 'n_cells_by_counts-3', 'mean_counts-3', 'pct_dropout_by_counts-3', 'total_counts-3', 'mt', 'n_cells_by_counts', 'mean_counts', 'pct_dropout_by_counts', 'total_counts', 'highly_variable', 'means', 'dispersions', 'dispersions_norm', 'mean', 'std'
    uns: 'log1p', 'hvg', 'pca', 'neighbors', 'umap', 'Batch_colors'
    obsm: 'X_pca', 'X_umap', 'X_pca_harmony', 'X_umap_Original'
    varm: 'PCs'
    obsp: 'distances', 'connectivities'
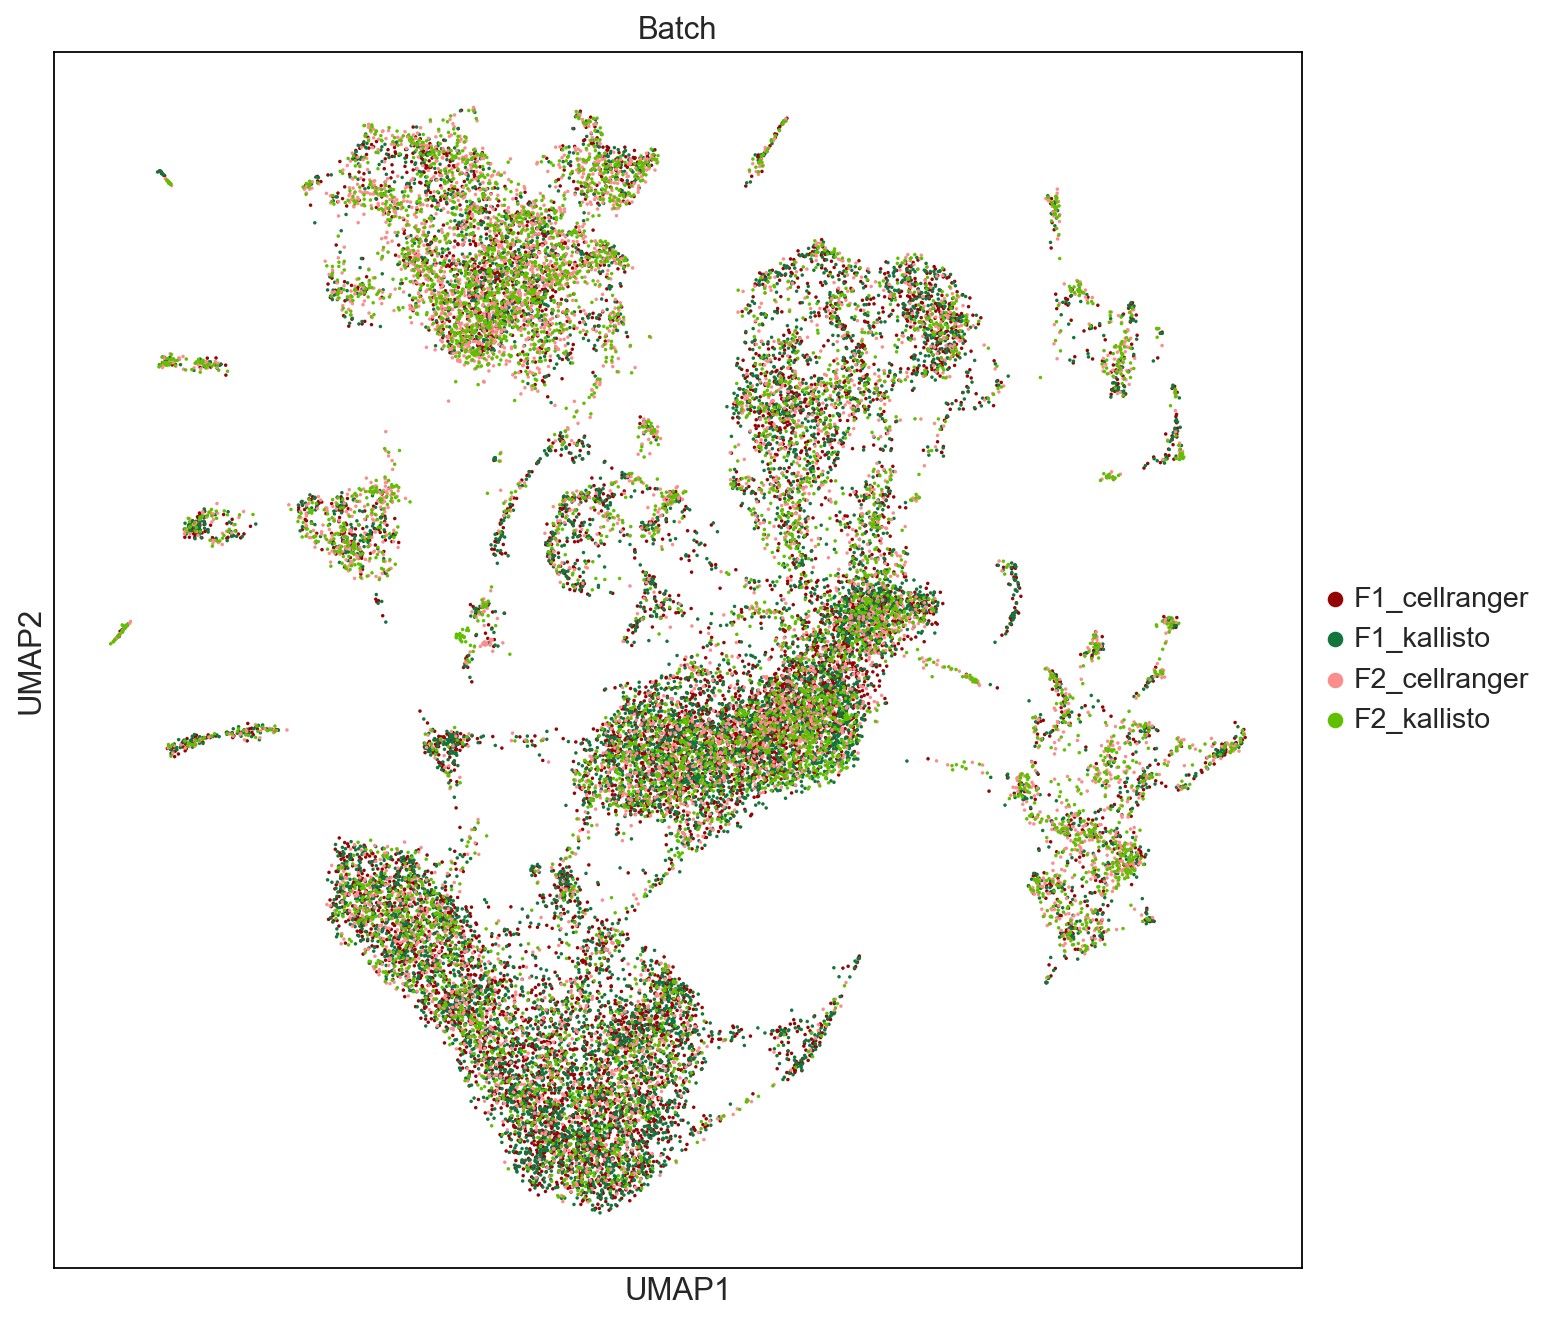
sc.tl.umap(AllCells, neighbors_key='neighbors_Harmony')
sc.settings.set_figure_params(dpi=80, facecolor='white', figsize=(10,10))
fig = sc.pl.umap(AllCells, color=['Batch'], palette = ['#940505', '#13743c','#fb8d8d','#60c000'], size = 10, save = 'UMAPbyBatch.pdf', ncols=2, use_raw = False)
WARNING: saving figure to file figures/umapUMAPbyBatch.pdf
sc.settings.set_figure_params(dpi=80, facecolor='white', figsize=(10,10))
fig = sc.pl.umap(AllCells, color=['Krt14','Ptprc','Enpp2'], palette = ['#940505', '#13743c','#fb8d8d','#60c000'], size = 10, save = 'UMAPgenes.pdf', ncols=2, use_raw = False) #ad2828
WARNING: saving figure to file figures/umapUMAPgenes.pdf
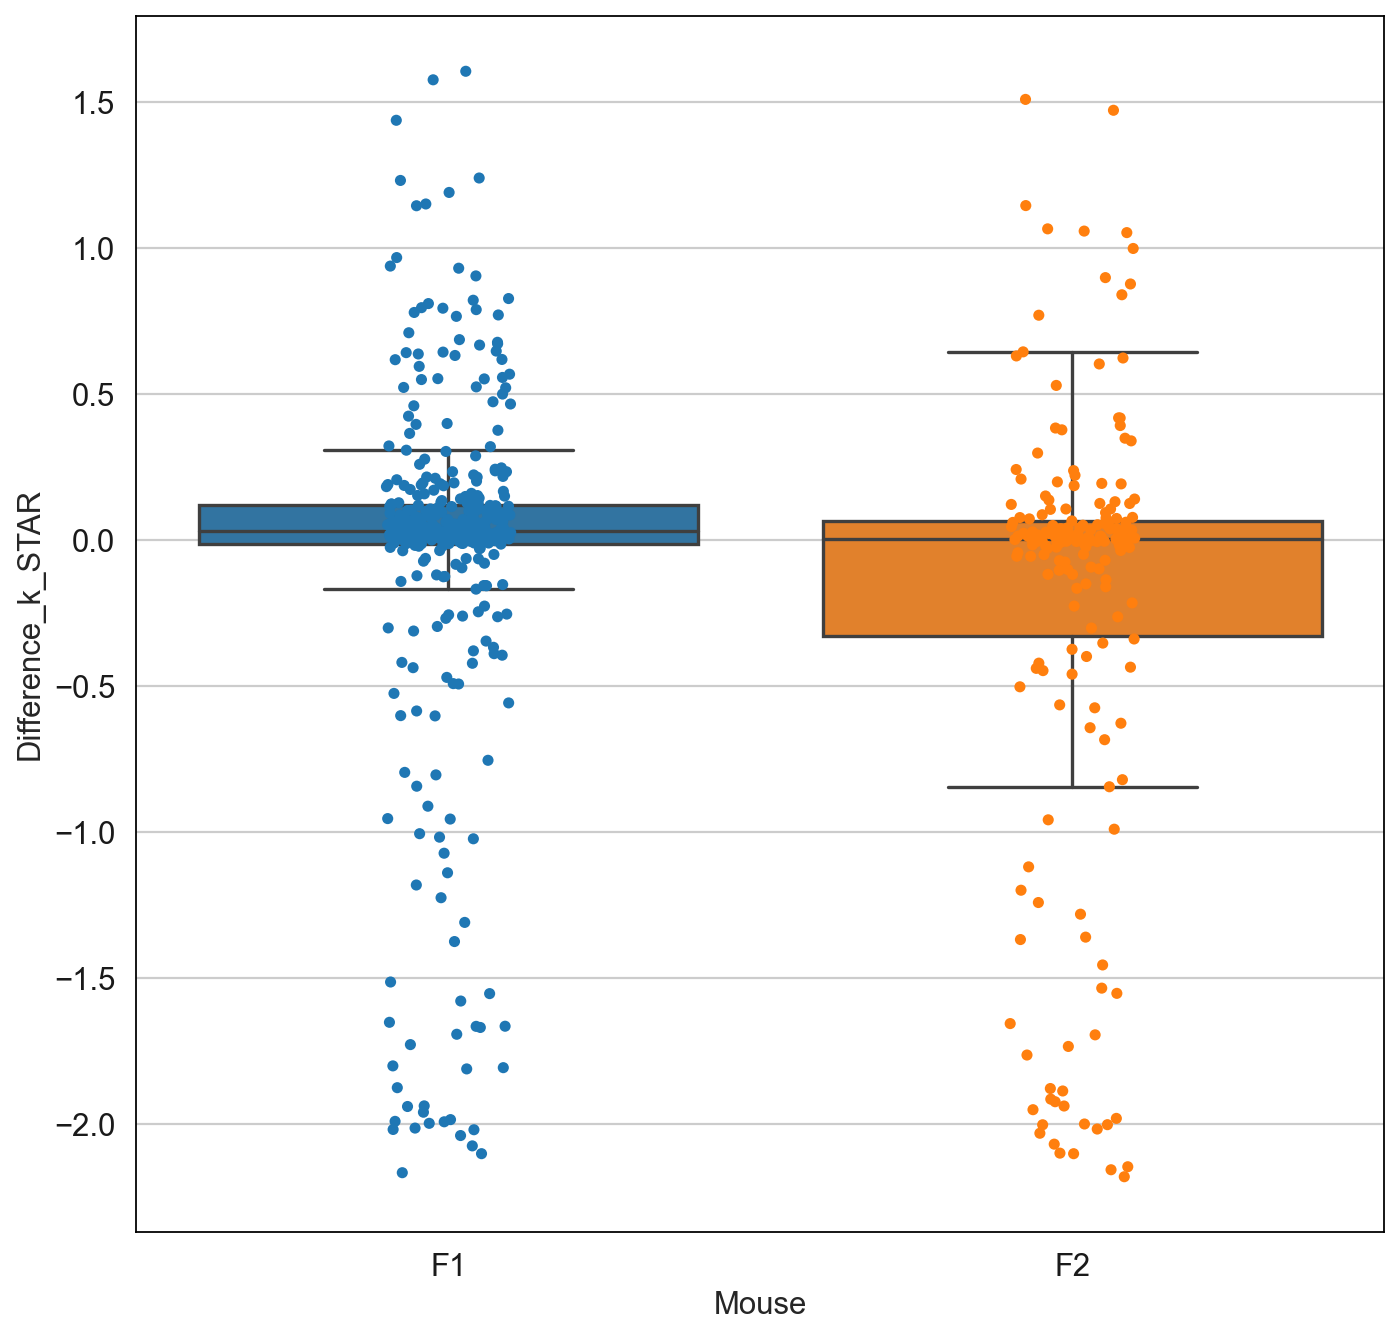
Calculate the difference between aligners in medians of each gene.
%%time

Difference_k_STAR = np.empty(len(AllCells.var.index.values)*2)

i = 0

GeneList = AllCells.var.index.values

MouseList = AllCells.obs['Mouse'].values

AlignerList = AllCells.obs['Aligner'].values

matrix = AllCells.X

for gene in GeneList:

    for mouse in ['F1','F2']:

        MouseIndex = MouseList == mouse

        subset = matrix[MouseIndex, GeneList == gene]

        temp_diff = np.median(subset[AlignerList[MouseIndex] == 'kallisto']) - np.median(subset[AlignerList[MouseIndex] == 'cellranger'])

        Difference_k_STAR[i] = temp_diff

        i += 1
CPU times: user 34.7 s, sys: 23 ms, total: 34.7 s
Wall time: 34.7 s
df_genes_diff = pd.DataFrame()
df_genes_diff['Mouse'] = np.tile(['F1','F2'],len(GeneList))
df_genes_diff['Difference_k_STAR'] = Difference_k_STAR
df_genes_diff['Genes'] = np.repeat(GeneList,2)
df_genes_diff
| Mouse | Difference_k_STAR | Genes | |
|---|---|---|---|
| 0 | F1 | 0.0 | Sox17 |
| 1 | F2 | 0.0 | Sox17 |
| 2 | F1 | 0.0 | Gm6085 |
| 3 | F2 | 0.0 | Gm6085 |
| 4 | F1 | 0.0 | Mrpl15 |
| ... | ... | ... | ... |
| 38181 | F2 | 0.0 | mt-Tp |
| 38182 | F1 | 0.0 | AC149090.1 |
| 38183 | F2 | 0.0 | AC149090.1 |
| 38184 | F1 | 0.0 | CAAA01147332.1 |
| 38185 | F2 | 0.0 | CAAA01147332.1 |
38186 rows × 3 columns
subsetdf = df_genes_diff[np.abs(df_genes_diff['Difference_k_STAR']) > 0.001]
subsetdf
| Mouse | Difference_k_STAR | Genes | |
|---|---|---|---|
| 98 | F1 | -0.252593 | Rpl7 |
| 99 | F2 | -0.434404 | Rpl7 |
| 308 | F1 | -1.308775 | Rpl31 |
| 324 | F1 | 0.644899 | Map4k4 |
| 386 | F1 | 0.041473 | Col3a1 |
| ... | ... | ... | ... |
| 38173 | F2 | 0.066550 | mt-Nd5 |
| 38174 | F1 | 1.232942 | mt-Nd6 |
| 38175 | F2 | 1.146825 | mt-Nd6 |
| 38176 | F1 | 0.047487 | mt-Cytb |
| 38177 | F2 | 0.053453 | mt-Cytb |
601 rows × 3 columns
len(subsetdf[subsetdf['Mouse'] == 'F1'])
403
len(subsetdf[subsetdf['Mouse'] != 'F1'])
198
sns.boxplot(data=subsetdf, y = 'Difference_k_STAR', x = 'Mouse', fliersize=0)
sns.stripplot(data=subsetdf, y = 'Difference_k_STAR', x = 'Mouse')
plt.savefig('/Users/emmanueldollinger/Desktop/DistOfGenes.pdf', dpi=300, transparent = False)
subsetdf['diffAbs'] = np.abs(subsetdf['Difference_k_STAR'])
/Users/emmanueldollinger/miniconda3/lib/python3.7/site-packages/ipykernel_launcher.py:1: SettingWithCopyWarning:
A value is trying to be set on a copy of a slice from a DataFrame.
Try using .loc[row_indexer,col_indexer] = value instead

See the caveats in the documentation: https://pandas.pydata.org/pandas-docs/stable/user_guide/indexing.html#returning-a-view-versus-a-copy
  """Entry point for launching an IPython kernel.
subsetdf.sort_values('diffAbs', ascending=False,inplace=True)
/Users/emmanueldollinger/miniconda3/lib/python3.7/site-packages/ipykernel_launcher.py:1: SettingWithCopyWarning:
A value is trying to be set on a copy of a slice from a DataFrame

See the caveats in the documentation: https://pandas.pydata.org/pandas-docs/stable/user_guide/indexing.html#returning-a-view-versus-a-copy
  """Entry point for launching an IPython kernel.
subsetdf
| Mouse | Difference_k_STAR | Genes | diffAbs | |
|---|---|---|---|---|
| 37189 | F2 | -2.179982 | Fau | 2.179982 |
| 21934 | F1 | -2.166188 | Rpl13 | 2.166188 |
| 15999 | F2 | -2.156097 | Rps16 | 2.156097 |
| 21935 | F2 | -2.145788 | Rpl13 | 2.145788 |
| 25903 | F2 | -2.101104 | Rps27a | 2.101104 |
| ... | ... | ... | ... | ... |
| 34602 | F1 | 0.001784 | Dusp1 | 0.001784 |
| 8312 | F1 | -0.001540 | Selenof | 0.001540 |
| 12273 | F2 | -0.001498 | Dynll1 | 0.001498 |
| 35116 | F1 | 0.001307 | H2-D1 | 0.001307 |
| 23101 | F2 | -0.001021 | Itm2b | 0.001021 |
601 rows × 4 columns
subsetdf['Genes'][0:75].values
array(['Fau', 'Rpl13', 'Rps16', 'Rpl13', 'Rps27a', 'Rps27a', 'Rpl28',
       'Rpl9', 'Rpl9', 'Rps12', 'Rpl11', 'Rps23', 'Rpl11', 'Rpl3', 'Rpl3',
       'Rpl17', 'Rps23', 'Rps12', 'Rpl10', 'Rps13', 'Rpl17', 'Rpl7a',
       'Rps13', 'Rpl10a', 'Rps7', 'Rpl12', 'Rpl12', 'Gnas', 'Rpl10',
       'Rpl21', 'Rpl7a', 'Rpl10a', 'Rps7', 'Rpl21', 'Rpl5', 'Rpl36a',
       'Rpl34', 'Rpl5', 'Rps17', 'Rpl36a', 'Rps16', 'Rpl28', 'Hspa8',
       'Rpl23a', 'Gnas', 'Rpl34', 'Ap1s3', 'Ppib', 'AC160336.1', 'Rps6'],
      dtype=object)
np.sum(subsetdf['Difference_k_STAR'][0:75].values < 0)
64